

Explore Agency Through Gallery Stories
Gallery Stories turn the data in your Talent Tree into clear, visual narratives about your organization. Each Gallery Story is a reusable template that brings together relevant Stories, evidence, data, and connections to answer a meaningful question about your people.
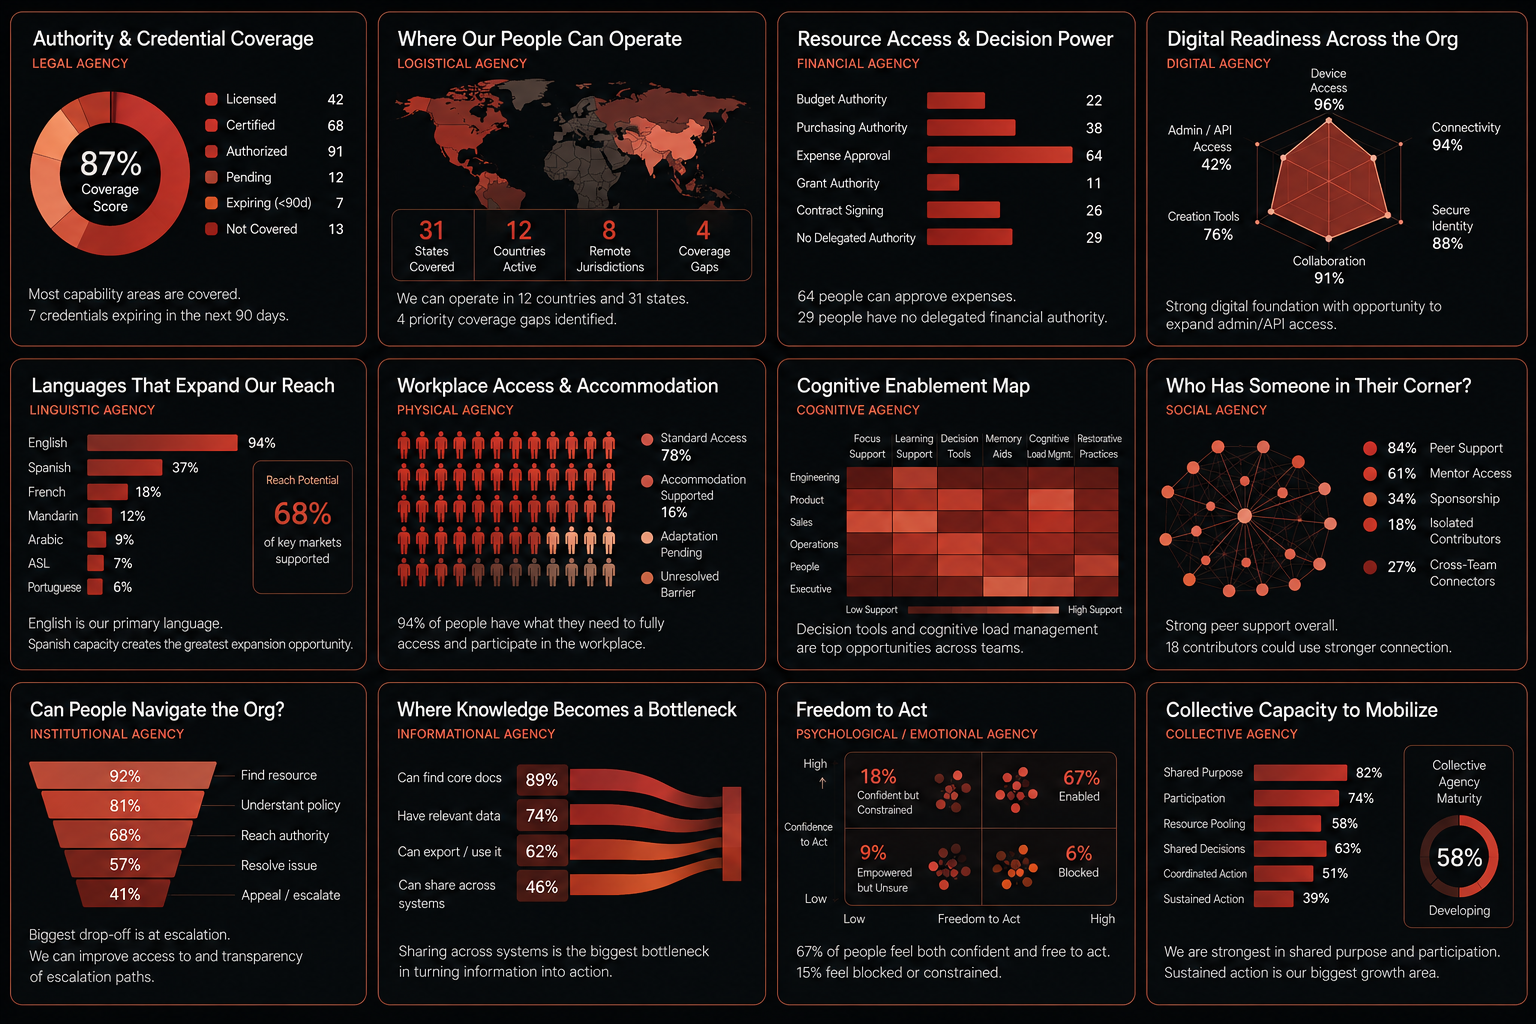
The examples below show just some of the ways Agency data can be explored—from credentials and resource access to digital readiness, support networks, institutional access, and collective capacity. As your Talent Tree grows, these templates can be populated with your organization’s data, filtered for different teams or populations, and adapted to reveal the patterns that matter most to you.
These are examples, not a fixed dashboard. The Gallery is designed to turn a living Talent Tree into many different views of what enables your people to act—and where additional support, access, or opportunity could unlock more of their potential.
Authority & Credential Coverage See the licenses, certifications, authorizations, and formal permissions your people hold—and where important coverage may be missing or approaching expiration. This turns scattered credential records into a live picture of where your organization is authorized and ready to act. | Where Our People Can Operate Understand the geographic and logistical reach of your people across states, countries, remote environments, and other operating contexts. Identify where you already have coverage and where mobility, access, availability, or infrastructure may limit your ability to respond. | Resource Access & Decision Power See where financial authority and access to resources actually sit across the organization—from purchasing and expense approval to budgets, contracts, grants, and other decision rights. This can reveal both concentrations of authority and people whose responsibilities exceed the resources they can control. | Digital Readiness Across the Organization Understand whether people have the digital access they need to contribute effectively, including devices, connectivity, secure identity, collaboration tools, creation platforms, permissions, and system access. It helps distinguish a skills gap from an enablement gap. |
Languages That Expand Our Reach See the languages your people can use and the depth of that capability across the organization. Linguistic Agency can reveal where existing talent expands access to customers, communities, partners, learners, or markets—and where additional language capacity could open new possibilities. | Workplace Access & Accommodation Understand whether people have the physical environments, tools, adaptations, and accommodations they need to participate fully. Rather than evaluating the individual, this view focuses on whether the conditions around people enable them to contribute. | Cognitive Enablement Map See how well different teams are supported with the conditions and tools that help people think, learn, focus, remember, make decisions, and manage cognitive load. Comparing these supports across the organization can reveal barriers that ordinary performance data would never explain. | Who Has Someone in Their Corner? Map the human support networks that help people act—from peers and mentors to sponsors, advocates, and cross-team connections. This makes social resources visible and can reveal both highly connected contributors and people or groups operating with too little support. |
Can People Navigate the Organization? See how easily people can find resources, understand policies, reach decision-makers, resolve problems, and use escalation or appeals channels. Institutional Agency reveals the difference between simply having organizational systems and people actually being able to use them. | Where Knowledge Becomes a Bottleneck Follow the path from finding information to accessing, using, sharing, and applying it. This view can expose where knowledge gets trapped by permissions, systems, silos, poor discoverability, or other barriers—preventing available information from becoming useful action. | Freedom to Act Explore the relationship between people’s confidence to act and the autonomy or permission their environment gives them. It can distinguish people who feel genuinely enabled from those who have capability but feel constrained—or have authority without the confidence or support to use it. | Collective Capacity to Mobilize See whether groups can turn shared purpose into coordinated action by combining participation, resources, decision-making, organization, and sustained effort. Collective Agency reveals not simply whether people agree, but whether they possess the conditions to act together effectively. |
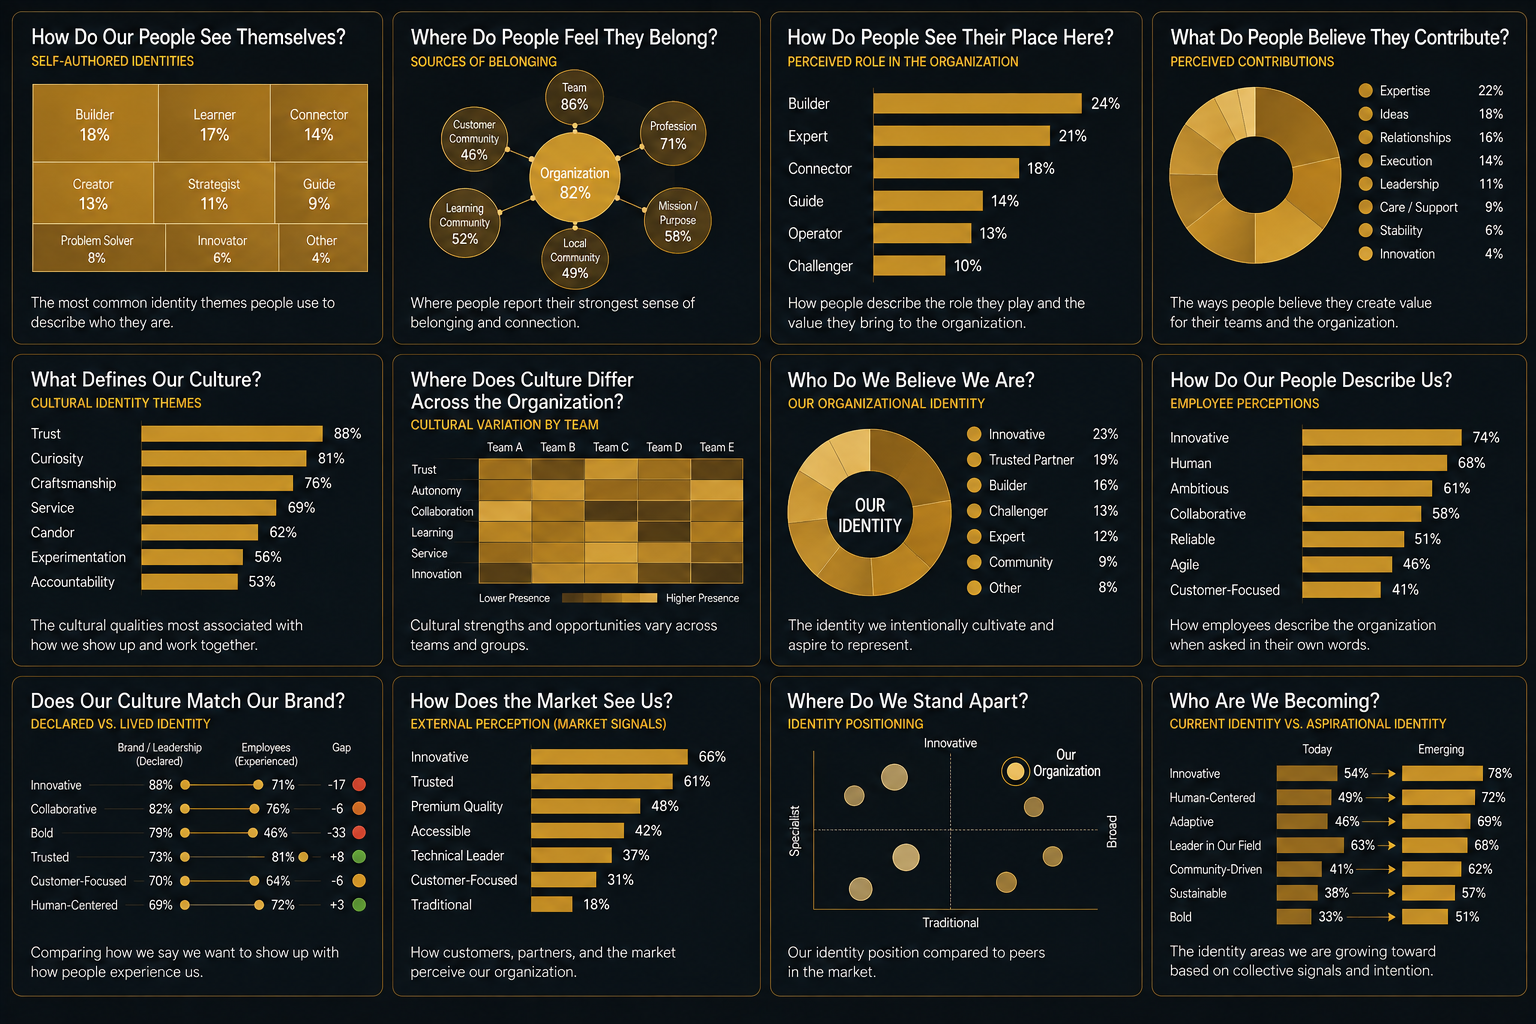
Explore Identity Through Gallery Stories
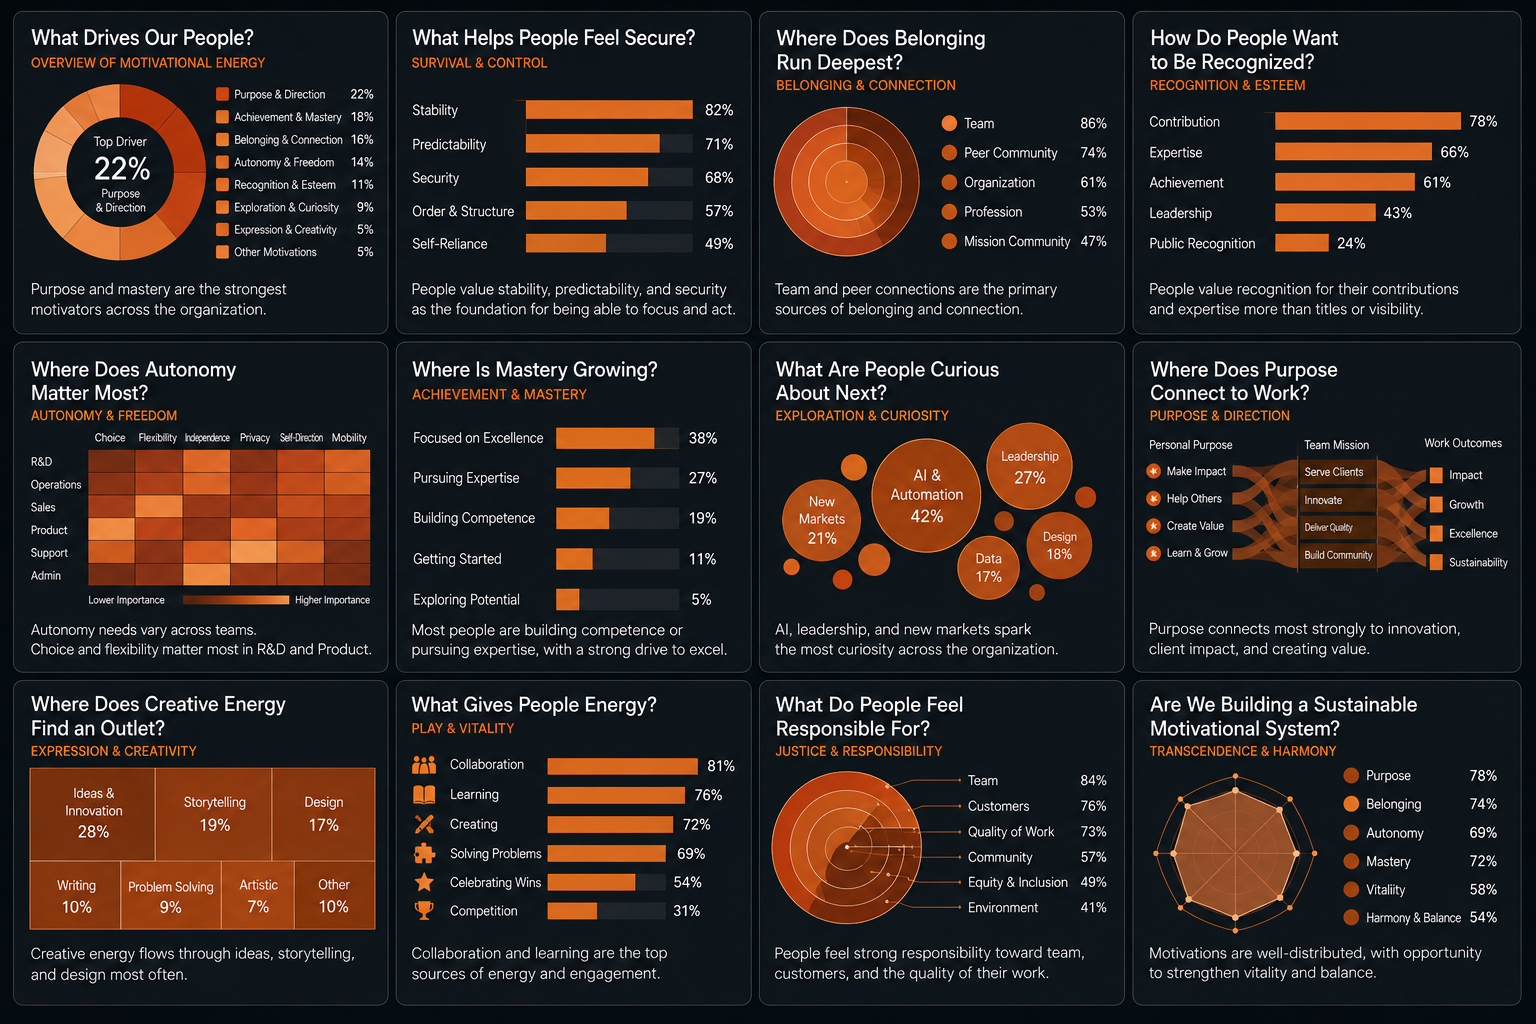
Gallery Stories turn Identity data into visual narratives about how people understand themselves, how they understand their place within the organization, and how the organization understands itself. Each Gallery Story is a reusable template that combines appropriately shared Stories, organizational frameworks, cultural signals, and connected Talent Tree data to reveal patterns of belonging, contribution, culture, brand, and collective identity.
The examples below show just some of the ways Combined Identity data can be explored. These are example Gallery templates, not fixed dashboards. Depending on the organization and the data available, Identity can be viewed across teams, locations, functions, communities, programs, or other relevant groups—and can incorporate both internally generated and appropriately sourced external signals.
Importantly, Identity is not treated as a permanent label or an organizational judgment about a person. The Talent Tree treats Identity as multidimensional and evolving, including personal, professional, community, creative, relational, digital, cultural, and aspirational dimensions. In a Combined Talent Tree, those individual stories can also help illuminate the collective identity of the organization itself—who its people believe they are together, how they experience the culture, and who the organization is becoming.
| How Do Our People See Themselves? See the self-authored identities people most often use to describe themselves—such as builder, learner, connector, creator, strategist, guide, or problem solver. Rather than reducing people to job titles, this view reveals the broader ways they understand the value and perspective they bring. | Where Do People Feel They Belong? Explore where people experience their strongest sense of connection, whether that is to their immediate team, the organization, a profession, a customer community, a mission, or another community. This helps reveal the different layers of belonging that connect people to the organization and to one another. | How Do People See Their Place Here? Understand how people describe the part they play within the organization—builder, expert, connector, guide, operator, challenger, or other forms of contribution. This provides a more human view of organizational usefulness than hierarchy or title alone. | What Do People Believe They Contribute? See the forms of value people believe they bring, from expertise and ideas to relationships, execution, leadership, care, stability, and innovation. Combined with Roles, Activities, Skills, and evidence elsewhere in the Tree, these self-perceptions can become richer stories about how contribution actually occurs. |
| What Defines Our Culture? Surface the qualities most consistently associated with how people experience working together—such as trust, curiosity, craftsmanship, service, candor, experimentation, or accountability. Instead of treating culture as a slogan, this view helps reveal the identity being created through everyday experiences. | Where Does Culture Differ Across the Organization? Compare cultural signals across teams, functions, locations, or other groups. Organizations rarely have one perfectly uniform culture, and this view can reveal where different forms of trust, autonomy, collaboration, learning, service, or innovation are emerging. | Who Do We Believe We Are? See the organizational identity the company intentionally defines for itself—perhaps as an innovator, trusted partner, builder, challenger, expert, community, or another combination of qualities. This reflects the organization’s own Identity Stories, frameworks, mission, brand, and strategic narrative. | How Do Our People Describe Us? Compare the intended organizational identity with the words and themes employees or members actually associate with the organization. This helps reveal whether people experience the organization in the way leadership and brand strategy intend. |
| Does Our Culture Match Our Brand? Compare declared identity with lived identity across important qualities. If the organization describes itself as bold, innovative, collaborative, human-centered, or trusted, this view can show where lived experience reinforces that promise—and where meaningful gaps may exist. | How Does the Market See Us? Bring appropriate external signals into the Identity picture, such as customer, partner, member, alumni, reputation, or market perceptions. This creates an outside-in view of organizational identity and shows how the brand is actually being understood beyond the organization itself. | Where Do We Stand Apart? Explore how the organization is positioned relative to peers or competitors across meaningful identity dimensions—such as innovative versus traditional, specialist versus broad, premium versus accessible, or other relevant comparisons. This can help leaders understand not simply what the organization does, but what makes it distinct. | Who Are We Becoming? Compare today’s collective identity with the qualities the organization and its people are increasingly growing toward. Changes in Stories, culture, leadership, strategy, skills, interests, and aspirations can reveal an emerging identity before it is fully reflected in the company’s structure or brand. |
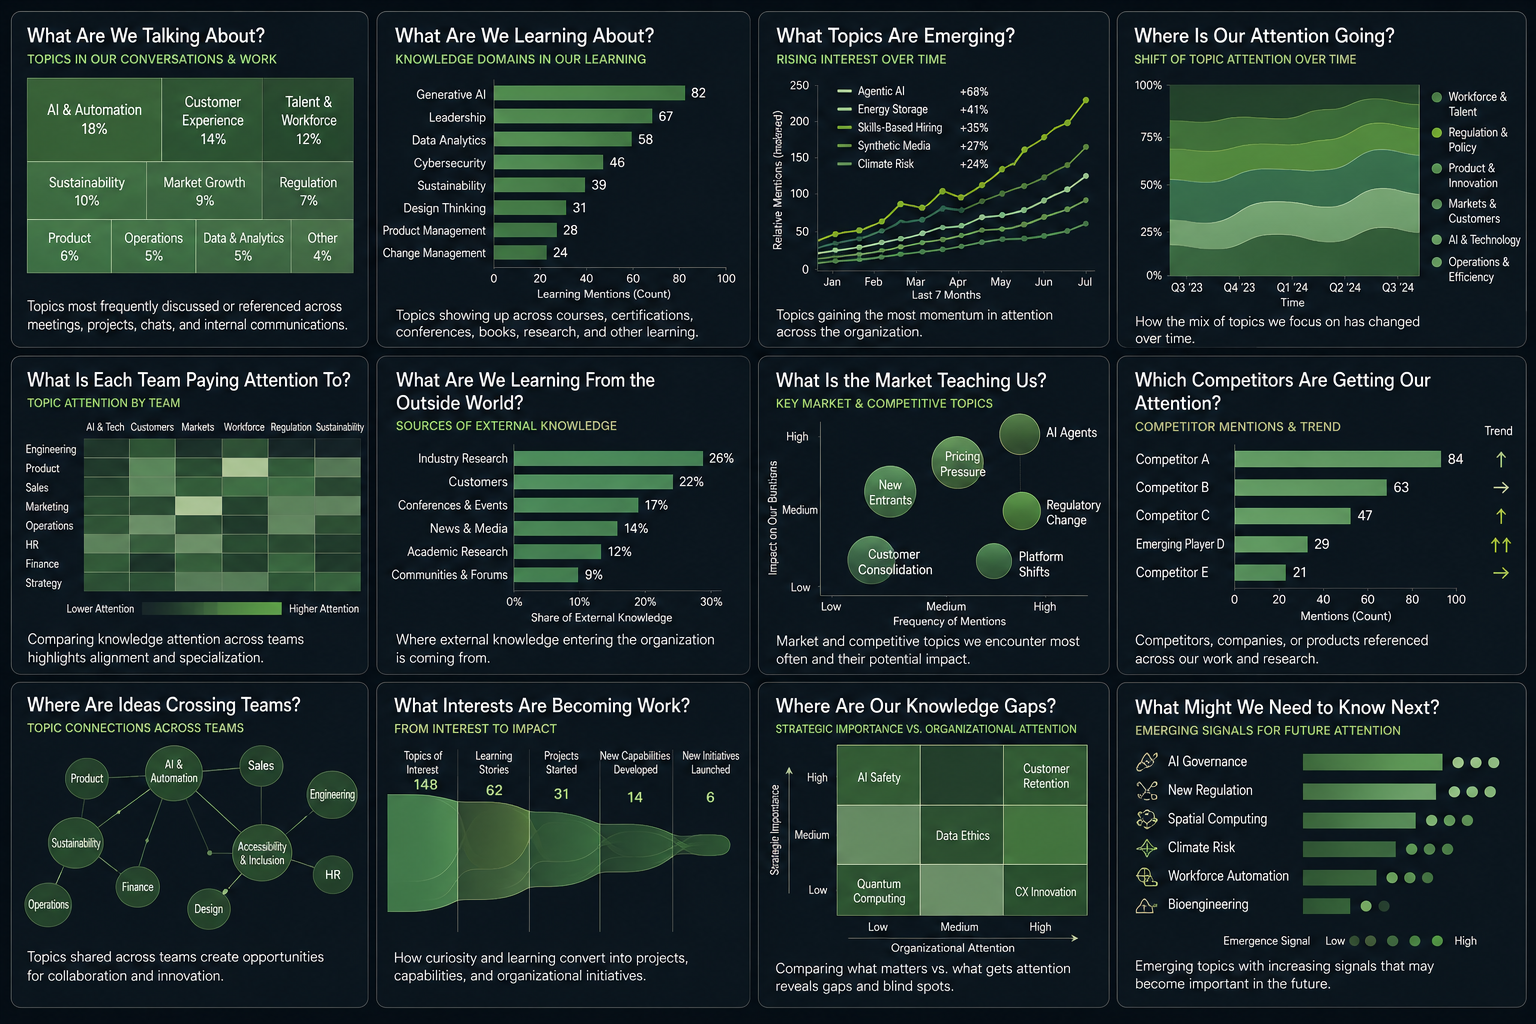
Explore Interests Through Gallery Stories
Gallery Stories turn Interests data into a living map of what an organization is paying attention to, learning about, discussing, researching, and exploring. Rather than treating interests as a simple list of personal preferences, the Combined Talent Tree can organize knowledge domains and topics appearing across appropriately connected Stories, learning, projects, meetings, research, resources, and other organizational activity.
The examples below show some of the ways Combined Interests data can be explored—from the subjects attracting attention today to emerging topics, competitive intelligence, cross-team knowledge flows, and areas the organization may need to understand next. These are example Gallery templates, not fixed dashboards. They can be populated with the knowledge sources available to an organization and filtered across teams, functions, projects, time periods, or other relevant contexts.
Interests are particularly valuable because they can capture an early signal before something becomes a formal capability. A topic may first appear in conversation, then become an area of learning, then a project, then a demonstrated skill or organizational capability. The Talent Tree makes that progression visible by connecting Interests to Stories across Activities, Skills, Creativity, Wisdom, Potential, and other Nodes.
| What Are We Talking About? See the topics most frequently appearing across appropriately connected meetings, projects, conversations, research, and other work. This provides a broad view of the subjects occupying organizational attention and how that attention is distributed across different knowledge domains. | What Are We Learning About? Explore the topics showing up across continuing education, certifications, courses, conferences, professional development, research, books, and other learning experiences. This reveals where people are actively expanding their knowledge—even when that learning has not yet become a formal skill. | What Topics Are Emerging? Identify knowledge domains whose presence is increasing over time. A rapid rise in discussion, learning, research, or project activity can reveal emerging areas of organizational interest before they appear in strategic plans or traditional workforce data. | Where Is Our Attention Going? See how the organization’s attention changes over time. As markets, technologies, customer needs, projects, and priorities evolve, this view reveals which subjects are gaining mindshare, which are becoming established, and which are beginning to recede. | |
| What Is Each Team Paying Attention To? Compare knowledge interests across teams, functions, departments, or other groups. This can reveal areas of specialization as well as topics that are spreading across organizational boundaries—helping leaders understand both the diversity and overlap of organizational attention. | What Are We Learning From the Outside World? Understand where external knowledge entering the organization originates—from customers and industry research to conferences, professional communities, academic work, news, partners, and other sources. This provides a picture of the organization’s broader knowledge ecosystem, not simply its internal expertise. | What Is the Market Teaching Us? See the market, customer, technology, regulatory, and competitive topics appearing most frequently across relevant organizational Stories. This turns scattered observations into a structured picture of the external forces people across the organization are noticing. | Which Competitors Are Getting Our Attention? See which competitors, products, organizations, or emerging players are being discussed, researched, or referenced—and how that attention is changing. Rather than creating a static competitor list, this view reveals where competitive attention is actually flowing across the organization. | |
| Where Are Ideas Crossing Teams? Map knowledge domains that connect otherwise different parts of the organization. When the same topic appears across Product, Sales, Operations, HR, Strategy, or other teams, it can reveal opportunities for collaboration, knowledge sharing, and new combinations of expertise. | What Interests Are Becoming Work? Follow the progression from curiosity to capability. See where topics of interest lead to learning Stories, experiments, projects, demonstrated capabilities, or new initiatives. This helps leaders understand which areas of organizational curiosity are actually translating into action. | Where Are Our Knowledge Gaps? Compare the subjects considered strategically important with the attention and learning they are currently receiving. This can reveal areas where the organization is deeply informed, as well as important domains that may be receiving surprisingly little exploration. | What Might We Need to Know Next? Surface topics showing early signals of increasing relevance through internal attention, external developments, learning activity, projects, or other connected data. This is not intended to predict the future; it helps leaders recognize where further curiosity and investigation may be worthwhile. |
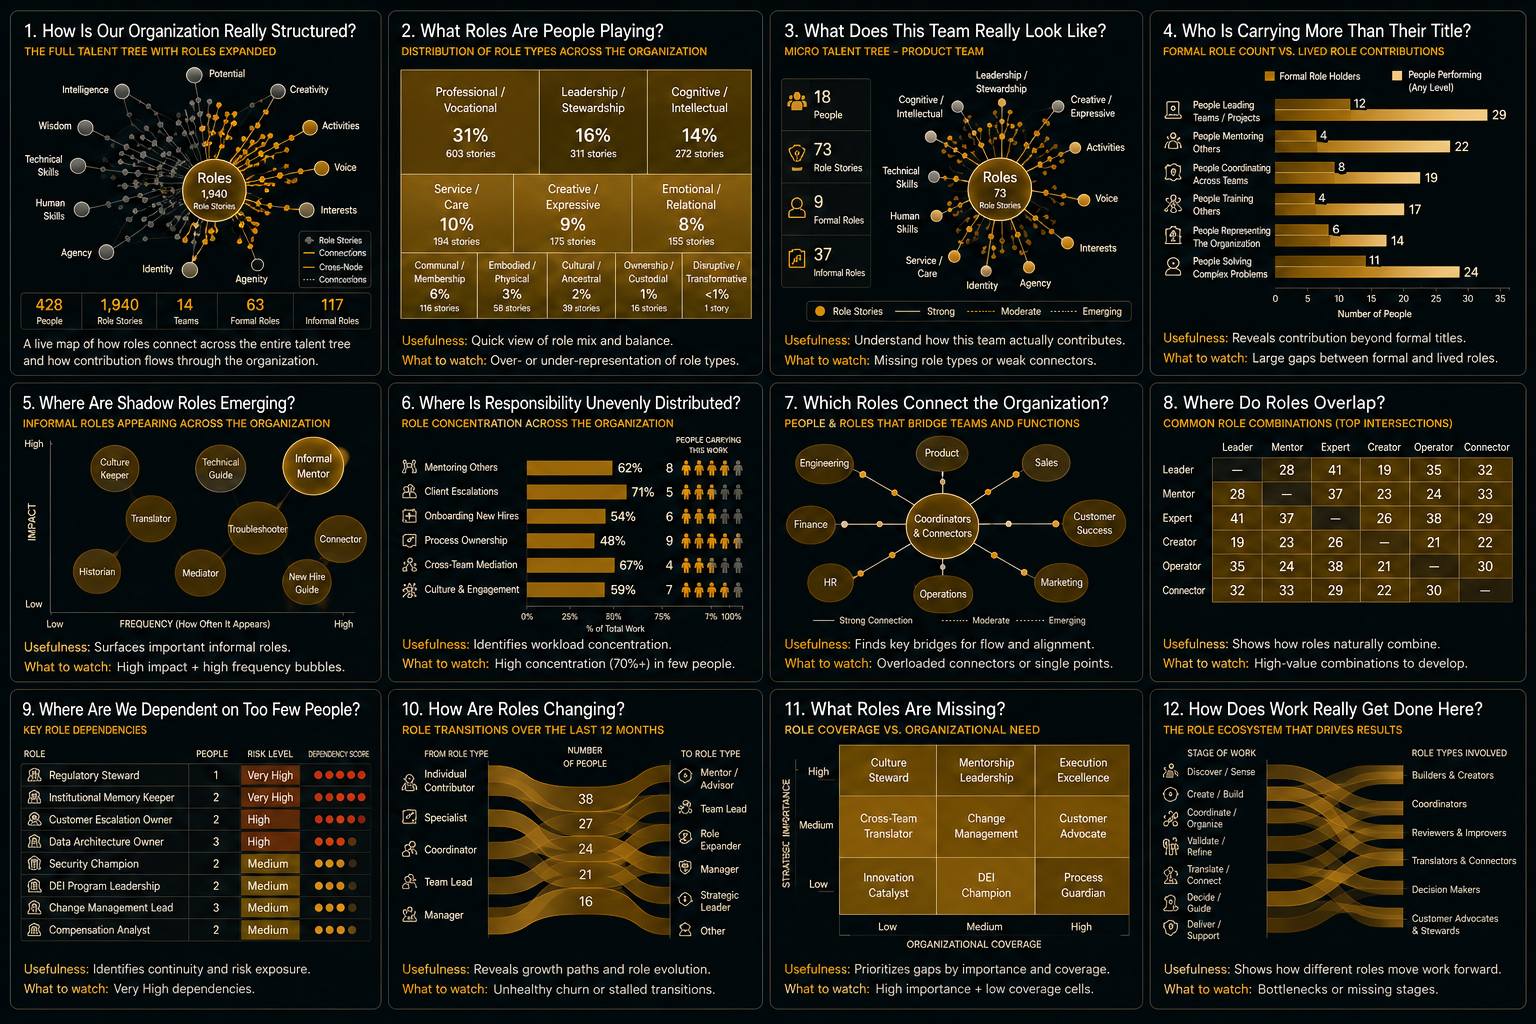 Explore Roles Through Gallery Stories
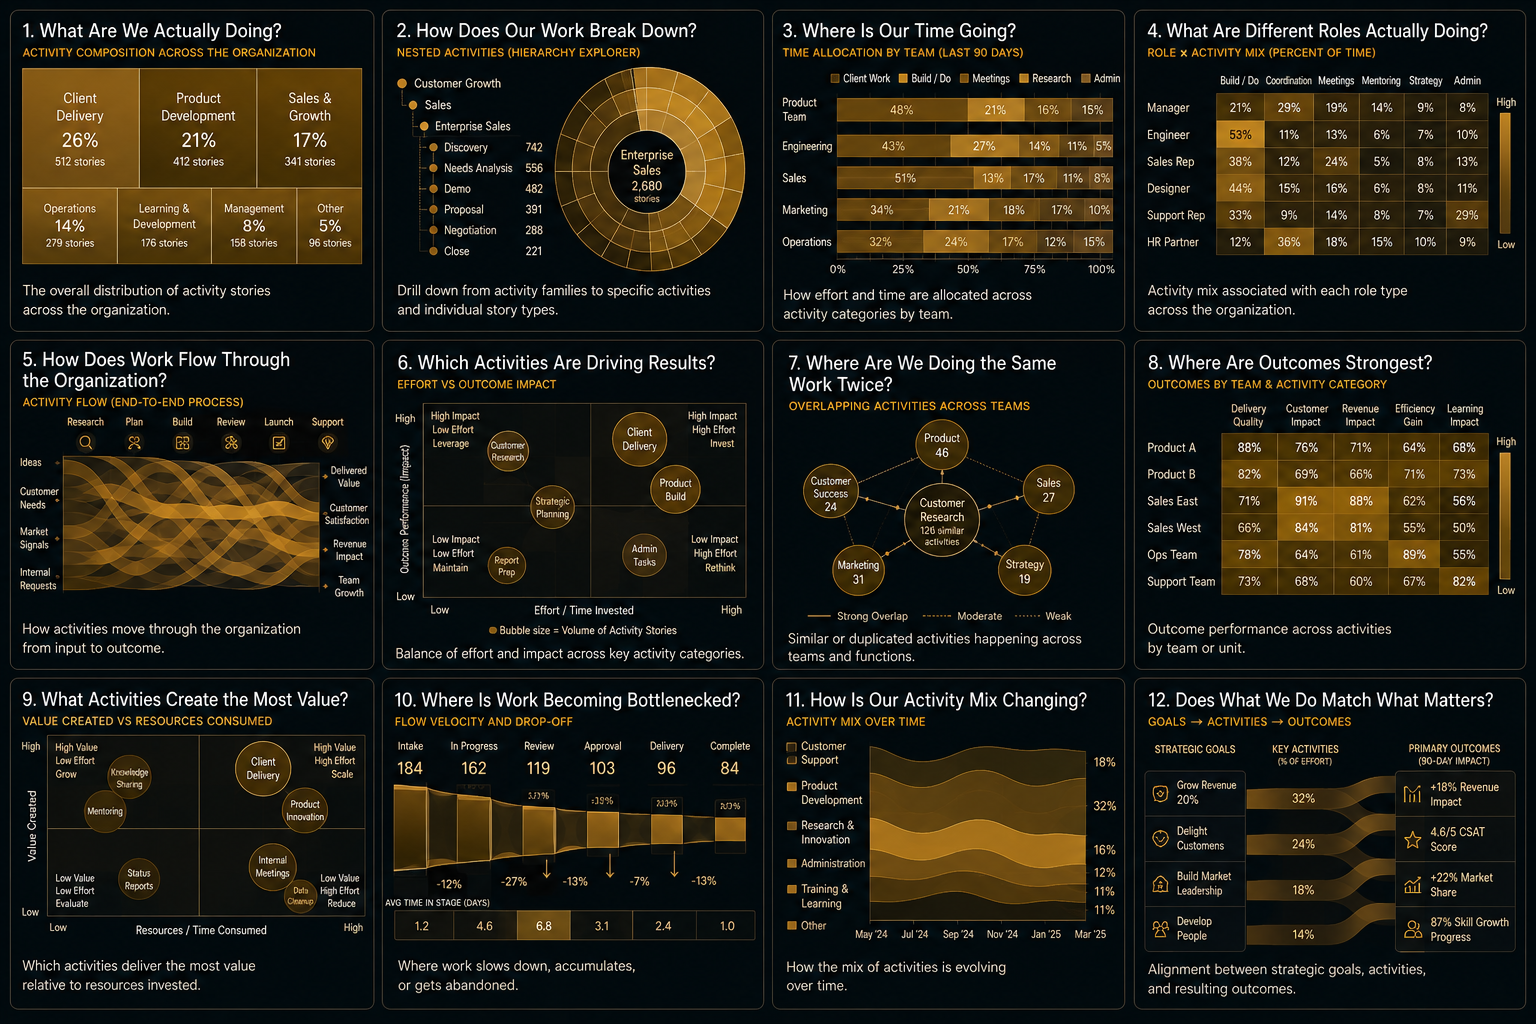
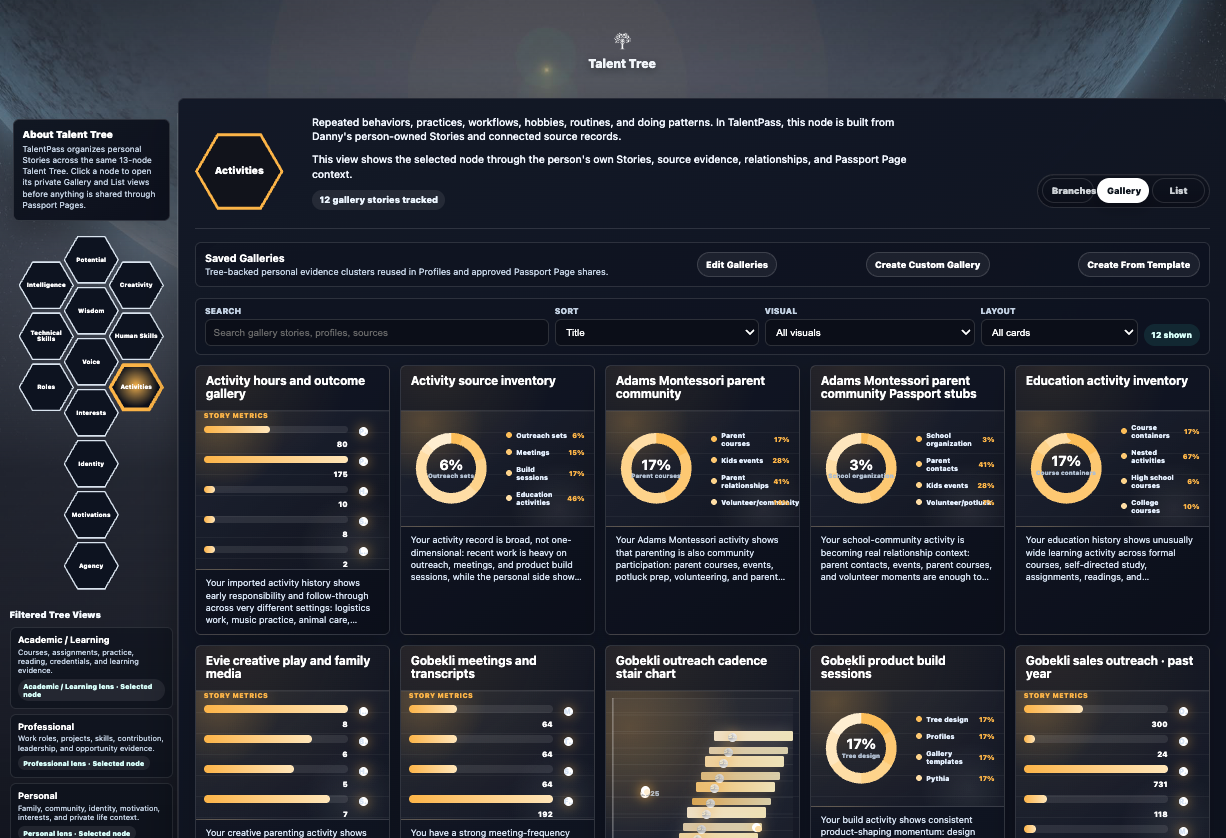
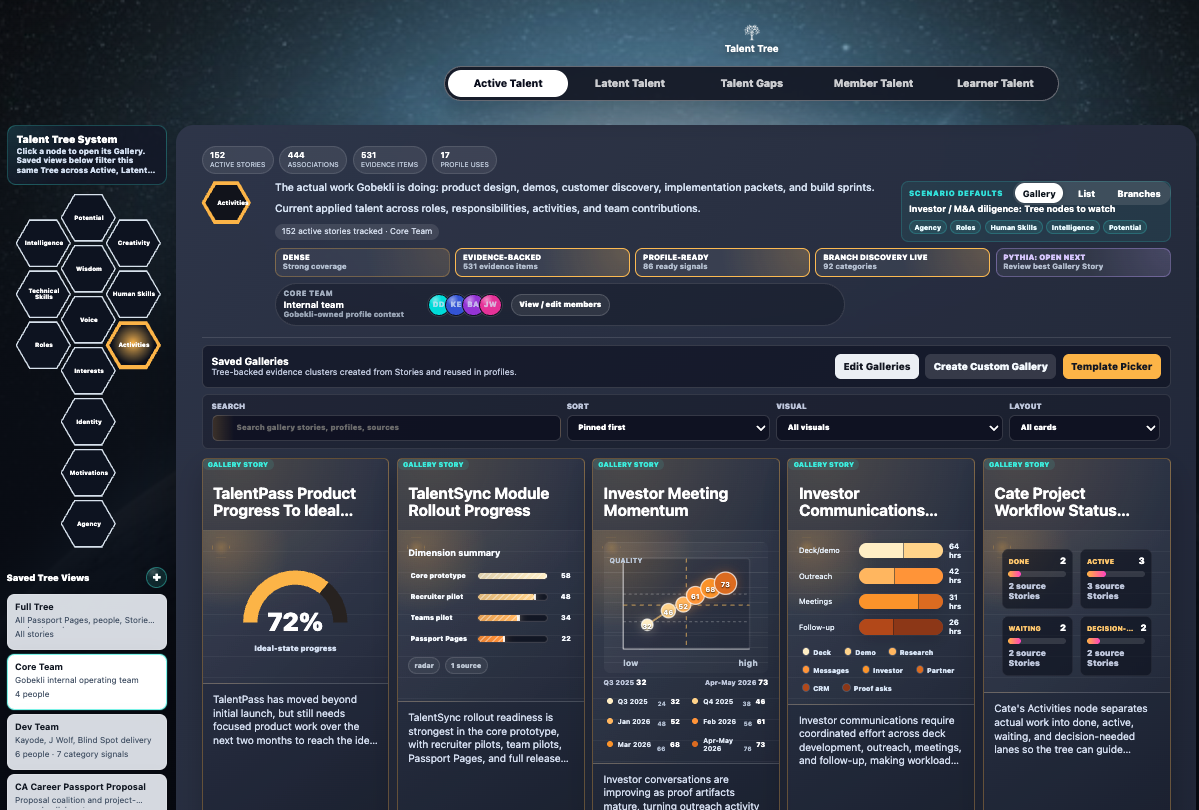
Explore Activities Through Gallery Stories
Gallery Stories turn Activities data into a living picture of what an organization is actually doing. Every project, task, initiative, learning experience, interaction, and contribution can become an Activity Story with its own context, evidence, data, metrics, and outcomes. Those Activities can then be nested into larger bodies of work and connected to Roles, teams, goals, skills, and other parts of the Combined Talent Tree.
The examples below show some of the ways Combined Activities data can be explored—from the overall composition of work and where time is going to workflows, performance, outcomes, duplication, bottlenecks, and strategic alignment. These are example Gallery templates, not fixed dashboards. Different organizations can define the Activity structures and measures that matter to them, then view the resulting data by team, role, project, activity type, time period, or other relevant context.
Activities are especially powerful because they provide the Tree with a record of what actually happened. The Talent Tree defines Activities as the specific experiences, projects, tasks, and accomplishments through which talent is applied, while associations allow those experiences to connect with Roles, Skills, and the rest of the Tree.
| How Does Our Work Break Down? Explore Activities as a nested hierarchy, moving from broad bodies of work into increasingly specific activities and sub-activities. A category such as Customer Growth might contain Sales, which contains Enterprise Sales, which contains discovery, demonstrations, proposals, negotiation, and closing activities. Because Activities can be nested, each individual Story can contribute to increasingly larger views of the work—allowing leaders to move between the whole organization and the individual activity without losing context. | Where Is Our Time Going? See how time and effort are distributed across activity categories, teams, projects, or other groups. This can reveal how much capacity is going toward client work, building, meetings, research, administration, learning, support, or any other activity structure the organization chooses to examine. Time is particularly useful because the Talent Tree’s attribution model can connect portions of a person’s Role or experience to associated Stories and translate those relationships into attributed hours. | What Are Different Roles Actually Doing? Connect Roles with Activities to understand what participation actually looks like in practice. Managers, engineers, salespeople, designers, support teams, and other roles may spend their time very differently across teams—even when they share the same formal title. This makes it possible to compare assigned Roles with lived Roles and understand how responsibilities actually translate into work. | How Does Work Flow Through the Organization? Follow Activities as they move through an end-to-end process—from research and planning through building, review, launch, delivery, and support. Activities no longer have to appear as isolated tasks; their associations and parent-child relationships can reveal the larger workflows they collectively create. This can help leaders see where different teams participate in the same process and how individual contributions combine to produce an outcome. |
| Which Activities Are Driving Results? Compare the effort invested in different Activities with the outcomes they produce. Some Activities may consume significant resources while producing limited impact; others may require relatively little effort while generating disproportionately valuable results. Rather than assigning one universal measure of performance, this view can use the metrics and outcomes appropriate to each Activity or comparable activity category. | Where Are We Doing the Same Work Twice? Identify similar or overlapping Activities occurring across teams, projects, or functions. Research, reporting, customer discovery, data collection, planning, or content creation may be happening independently in several places without those groups realizing it. Making these overlaps visible can reveal opportunities to coordinate, reuse knowledge, share resources, or intentionally preserve useful redundancy. | Where Are Outcomes Strongest? Compare outcomes for similar Activities across teams, projects, locations, programs, or other relevant groups. The measures can change with the activity: delivery quality for one category, customer impact for another, efficiency for operations, learning impact for development, or revenue impact for commercial work. The point is not to force everything onto one score. It is to make meaningful like-for-like comparisons using the measures appropriate to the work. | What Activities Create the Most Value? Compare the resources consumed by an Activity with the value or outcomes it creates. This can surface high-leverage Activities worth expanding, resource-intensive Activities that may need redesign, and important work whose value may not be obvious from volume alone. Organizations can define value differently depending on context—revenue, quality, customer outcomes, learning, risk reduction, social impact, progress toward a goal, or other relevant measures. |
| Where Is Work Becoming Bottlenecked? See where Activities accumulate, slow down, require repeated rework, or fail to progress through a larger process. Comparing volume, completion, and time-in-stage can reveal constraints that are difficult to see when every task is viewed independently. This turns individual Activity Stories into a picture of organizational flow. | How Is Our Activity Mix Changing? Track changes in what the organization actually does over time. Customer support may decline as self-service improves. AI-assisted work may increase. Research may grow ahead of a new strategy. Administrative work may fall after automation. Learning may rise during a transformation. These changes create an empirical record of how the organization itself is evolving—not simply what its strategy says should be changing. | Does What We Do Match What Matters? Connect strategic goals to the Activities intended to advance them and then to the outcomes those Activities produce. This makes it possible to see whether organizational effort is actually flowing toward stated priorities—and whether that effort is generating the intended results. A goal can therefore become more than a statement on a planning document: Goal → Activities → People & Roles → Evidence → Metrics → Outcomes That relationship is possible because Stories across the Talent Tree can be connected through associations and attribution rather than remaining isolated records. Together, these Gallery Stories turn Activities into much more than a task log. They create a structured view of what the organization does, who is doing it, where effort goes, how work flows, what it produces, and how all of that changes over time. And because individual Activities remain connected to Roles and the rest of the Combined Talent Tree, leaders can move from an organizational outcome all the way back to the human experiences, capabilities, and contributions that helped create it. |
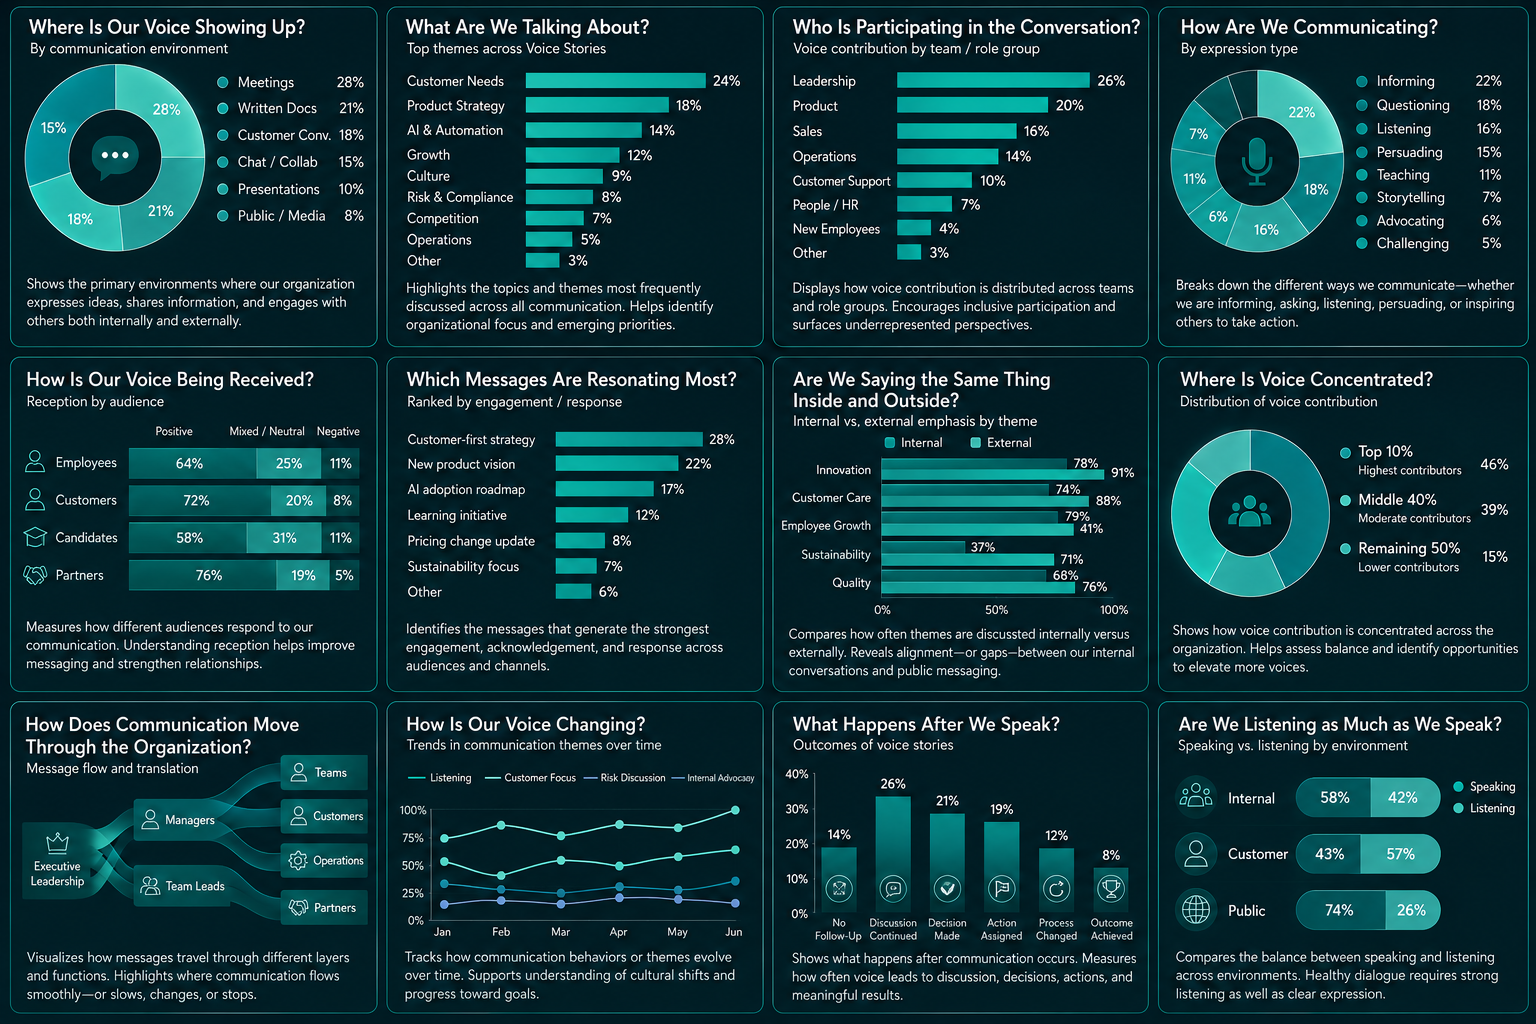
Explore Voice Through Gallery Stories
Gallery Stories turn Voice data into a living picture of how an organization communicates, listens, influences, and responds. Voice includes more than formal communications. It can capture the ideas expressed in meetings, presentations, written work, customer conversations, collaborative channels, public communications, feedback, and other moments where people or organizations express meaning.
The Talent Tree defines Voice as the expression of thought and influence—including writing, speaking, media presence, storytelling, and the ways ideas spread and affect others. In a Combined Talent Tree, those individual Voice Stories can become organizational intelligence: what people are talking about, who is participating, how messages are received, where communication travels, and what happens afterward.
The examples below are Gallery templates, not fixed dashboards. Each can be populated from the Voice Stories and associated data available to an organization, then filtered by team, Role, audience, channel, topic, time period, or other relevant context.
| Where Is Our Voice Showing Up? See the environments where organizational communication is taking place—from meetings and collaborative channels to written documents, customer conversations, presentations, and public communications. This provides a simple view of the organization’s communication footprint, helping leaders understand where ideas are being expressed and where important conversations are actually happening. | What Are We Talking About? Surface the topics and themes appearing most frequently across Voice Stories. These might include customer needs, product strategy, AI and automation, culture, competition, operational challenges, risk, or emerging areas of interest. Because Voice Stories can associate with other parts of the Talent Tree, these themes can also connect to Interests, Activities, Roles, and strategic priorities—showing not only what people care about, but what is actually entering organizational conversation. The Tree’s association model is specifically designed to connect Stories across Nodes rather than leave them as isolated records. | Who Is Participating in the Conversation? Explore how Voice is distributed across teams, functions, Roles, levels, or other appropriate groups. The purpose isn’t to rank individuals by how much they speak. It is to understand whose perspectives are represented in the conversations that shape the organization—and where participation may be unusually concentrated or limited. | How Are We Communicating? Understand the different functions communication is serving. Voice Stories might represent informing, questioning, listening, persuading, teaching, storytelling, advocating, or challenging. Seeing the mix helps reveal whether an organization’s communication culture is primarily broadcasting information, exploring ideas, building understanding, inviting response, or mobilizing action. |
| How Is Our Voice Being Received? Communication doesn’t end when something is said. See how different audiences respond to organizational Voice—from employees and customers to candidates, partners, communities, or other stakeholders. Reception data might include acknowledgement, response, engagement, sentiment, follow-up, or other appropriate evidence. This adds an essential second dimension to Voice: What did we say—and how did it land? | Which Messages Are Resonating Most? Identify the themes, messages, and ideas generating the strongest response. A new strategy may create widespread engagement. A product vision may generate questions. A customer-first initiative may begin appearing repeatedly in team discussions. Another message may receive little acknowledgement at all. Rather than simply measuring communication volume, this Gallery Story helps reveal which ideas are actually connecting with their intended audiences. | Are We Saying the Same Thing Inside and Outside? Compare the themes emphasized internally with those communicated externally. An organization might talk publicly about innovation while its internal conversations are dominated by operational stability. Employee development may be central internally but nearly absent from external messaging. Customer care might appear consistently in both. These differences aren’t automatically good or bad. They provide a way to examine narrative alignment between how the organization experiences itself and how it represents itself to the world. | Where Is Voice Concentrated? See whether organizational Voice is broadly distributed or disproportionately concentrated among a smaller number of teams, Roles, functions, or contribution groups. This can help leaders ask better questions about participation: Are enough perspectives entering the conversation? Are particular groups carrying most of the communication work? Where might valuable perspectives be less visible? The goal is visibility rather than judgment. TalentSync’s broader model is designed to surface patterns while preserving appropriate scope, consent, and user agency. |
| How Does Communication Move Through the Organization? Follow the path of important messages as they move between leadership, managers, teams, functions, customers, and other audiences. This can reveal where information travels smoothly, where it stops, and where its meaning changes as it moves through the organization. A strategy announced by leadership, for example, may be interpreted by managers, discussed by teams, translated into Activities, and eventually experienced by customers. Mapping that journey helps reveal communication as a system rather than a collection of messages. | How Is Our Voice Changing? Track changes in organizational Voice over time. The prevalence of particular topics might rise or fall. Listening may increase. Customer-focused discussion may become more common. Conversations about risk, innovation, learning, or culture may shift as circumstances change. Over time, Voice becomes a record of how the organization’s attention, language, and expression are evolving—providing another lens into changes that may be occurring across the Combined Talent Tree. | What Happens After We Speak? See what follows important moments of communication. A Voice Story might lead to: continued discussion → a decision → an assigned Activity → a process change → a measurable outcome | Are We Listening as Much as We Speak? Compare speaking, broadcasting, questioning, listening, and responding across different communication environments. An organization may listen closely in customer conversations while mostly broadcasting publicly. Internal meetings may show a healthier exchange between expression and response. Leadership communications may reveal another pattern entirely. This final view reinforces an important idea: Voice isn’t only the ability to speak. It is participation in an exchange. |

Explore Technical Skills Through Gallery Stories
Gallery Stories turn Technical Skills data into a living picture of the practical knowledge and specialized capabilities available across an organization. Instead of maintaining a static inventory of skills people claim to have, TalentSync can connect technical capability to the Roles in which it was developed, the Activities where it was applied, the evidence that supports it, and the outcomes it helped produce.
The examples below show some of the ways Combined Technical Skills data can be explored—from basic skill inventories and areas of expertise to proficiency, team distribution, skill combinations, development pathways, emerging capabilities, gaps, and organizational impact. These are example Gallery templates, not fixed dashboards. The same templates can be applied to an individual, team, department, candidate pool, learning cohort, membership organization, or entire workforce.
This matters because the Talent Tree is designed around connected Stories rather than isolated skill tags. Stories share a common structure of Details, Evidence, and Data, and associations can connect a Technical Skill to the Roles, Activities, learning experiences, and other Stories that give that skill context and credibility.
| What Technical Skills Do We Have? See the technical skills with the strongest demonstrated representation across the selected population—from data analysis, SQL, Python, Salesforce, and Excel to design tools, financial modeling, cloud technologies, cybersecurity, or any other relevant capability. This provides the simplest view of the organization’s technical capability: what do our people know how to do? Unlike a conventional skills inventory, the underlying data can be grounded in associated Stories and evidence rather than relying solely on a self-reported list. | Where Is Our Technical Expertise Concentrated? Group individual skills into broader technical domains such as Data & Analytics, Software Engineering, Business Systems, Design & Creative Technology, Finance & Modeling, or other organization-specific categories. This makes it possible to zoom out from hundreds or thousands of individual skills and understand the overall composition of technical capability across the organization. The Tree’s branching structure is particularly useful here because individual Stories can sit within increasingly larger taxonomic groupings while retaining their original context. | Which Skills Are Deepest? Explore not simply whether a skill exists, but the depth of demonstrated experience behind it. For a capability such as SQL, Salesforce, Python, Figma, Excel, or AWS, TalentSync can distinguish between different levels of evidence based on the frameworks and data available to the organization. A skill repeatedly applied across Roles and Activities with meaningful evidence tells a different story from one recently learned or lightly practiced. The exact proficiency framework can vary by organization rather than forcing every skill into one universal scale. | Which Skills Are Used in Which Roles? Connect Technical Skills with Roles to see where capabilities actually live within the organization. SQL may appear across analysts, product teams, operations, and marketers. Salesforce may span Sales, Customer Success, Operations, and leadership. Figma may appear beyond formal designers in Product or Research Roles. This view reveals the actual relationship between capability and participation—and can expose technical knowledge hiding outside the Roles where leaders would normally expect to find it. | |
| What Skills Power Our Work? Connect Technical Skills directly to the Activities where they are being applied. A Customer Analytics Activity might combine SQL, Tableau, and Excel. A Product Prototype might involve Figma, React, and APIs. Financial Planning could draw on Excel, modeling, and Power BI. This moves Technical Skills from: “We have this skill.” to: “This is what we use this skill to accomplish.” Because Talent Tree Stories can be associated across Nodes, Activities provide real-world context for where technical capability is actually being exercised. | How Is Our Skill Mix Distributed Across Teams? Compare technical capability across teams, departments, locations, programs, or other relevant groups. Product may have a strong combination of software, design, and analytics capabilities. Finance may concentrate modeling and business systems expertise. Operations may combine data, automation, and platform knowledge. Rather than simply comparing headcount, this view shows the different technical composition of each group and where additional capability, collaboration, or development might be useful. | Which Skills Travel Across the Organization? Identify technical skills appearing across the greatest number of teams, Roles, or functions. Some capabilities are highly specialized. Others—such as Excel, SQL, data visualization, CRM platforms, or AI tools—may act as organizational bridge skills, enabling people from otherwise different functions to collaborate around common tools and methods. This view can help reveal which capabilities are especially valuable for internal mobility, shared learning, cross-functional work, and organizational resilience. | Which Skills Work Together? Technical capability rarely operates one skill at a time. See the combinations of skills that repeatedly appear together across real Activities and Roles—for example: SQL + Data Modeling + Tableau Figma + Prototyping + Design Systems Python + Data Processing + Machine Learning Salesforce + CRM Administration + Reporting These recurring associations can reveal capability clusters that are more meaningful than individual skill labels and can help organizations understand the combinations of knowledge required to perform real work. The Talent Tree’s cross-story association model is specifically intended to create these larger narratives from connected experiences. | |
| Where Did Our Technical Skills Come From? See the experiences through which technical capability was developed. Skills may originate or grow through work experience, formal education, credentials and certifications, self-directed learning, projects, mentorship, or other learning experiences. This creates a richer picture of how the organization actually develops capability—and can help leaders understand which development pathways are contributing the kinds of technical knowledge they need. It also reflects a core principle of the Talent Tree: meaningful capability can emerge through many kinds of learning and experience, rather than only through formal credentials. | Which Skills Are Growing? Track the technical capabilities gaining evidence, application, or participation over time. AI tools may begin appearing rapidly across Activities. Python use may expand beyond technical teams. Data visualization may spread into operational Roles. A new platform introduced by the organization may begin generating a new cluster of capability. This provides a dynamic view of how the organization’s technical knowledge is evolving, rather than treating its skills inventory as a snapshot. | Where Do We Have Skill Gaps? Compare demonstrated technical capability with the skills required by a Role, project, team, strategy, opportunity, or adopted external framework. A team might have strong CRM administration but limited data engineering. A transformation initiative might require cloud architecture that is currently concentrated in only a few people. A new strategy may introduce technical requirements that barely appear in the current Combined Tree. This turns a traditional skills-gap analysis into something more contextual: What capability do we need? How much evidence do we currently have? Where does that capability already exist? Who has applied it? And in what context? The Tree is designed to adopt and crosswalk external skill and competency frameworks while preserving the underlying Stories that give those classifications meaning. | What Technical Capabilities Drive Outcomes? Connect technical capability to the Activities and measurable outcomes it helps produce. Automation skills might be associated with hours saved. Analytics capabilities might support important decisions. CRM expertise may contribute to pipeline outcomes. Product-design skills may support launches. Systems expertise may reduce incidents or improve reliability. This does not mean claiming that a skill alone caused an outcome. Instead, TalentSync can preserve the chain of associated evidence: Technical Skill → Role → Activity → Contribution → Outcome |
TalentSync can show what technical capabilities exist, then where they live, then how they are being applied, and finally how they connect to the work and outcomes the organization cares about.
And because the same underlying Gallery templates can be scoped differently, this intelligence is not limited to an enterprise workforce. The same visualization could describe the technical capabilities of one person, a project team, a candidate pool, a graduating class, a professional association, a department, or an entire organization.
That makes Technical Skills more than another database of keywords. It becomes a connected, evidence-bearing map of what people know how to do, where that knowledge came from, where it is being used, and what it is helping make possible.
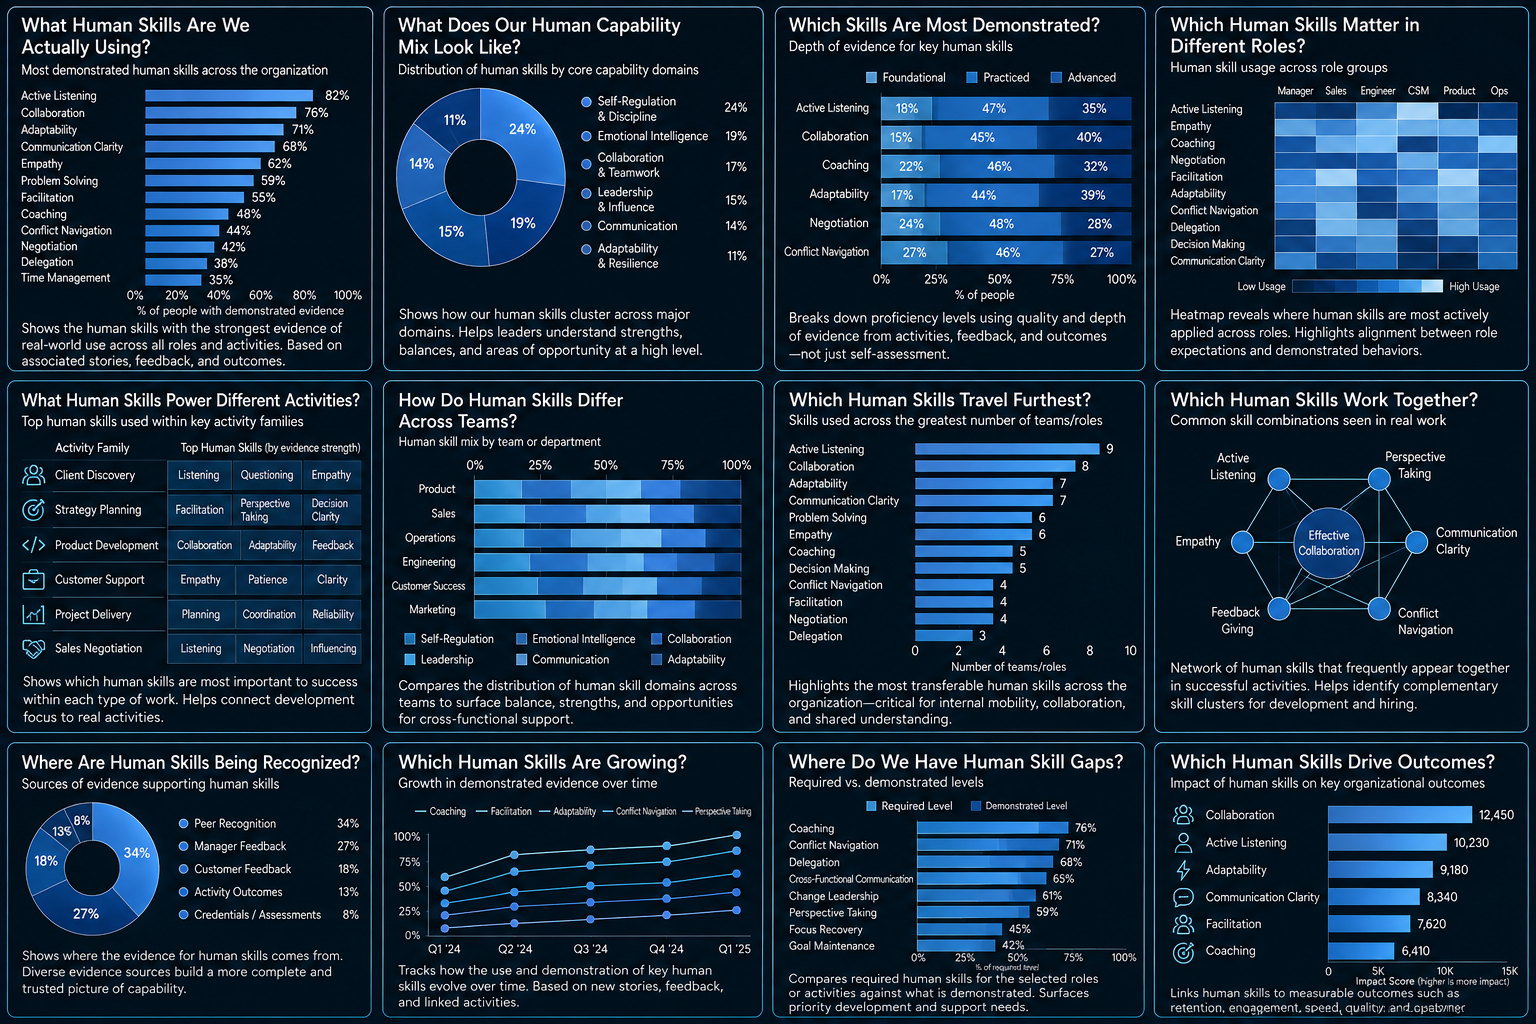
Explore Human Skills Through Gallery Stories
Gallery Stories turn Human Skills data into a detailed picture of how people actually work with others, manage themselves, navigate complexity, and contribute to outcomes. Instead of reducing human capability to broad labels such as “communication” or “leadership,” the Talent Tree’s 12×12 structure allows TalentSync to identify the much more specific Human Skills being demonstrated—or needed—within particular Roles, Activities, teams, and situations.
The examples below show some of the ways Combined Human Skills data can be explored—from individual skills and broader capability domains to the specific combinations required by different Roles and Activities, capability gaps, transferability, development, and outcomes. These are example Gallery templates, not fixed dashboards. The same templates can be applied to an individual, team, project, department, candidate pool, student cohort, membership organization, or entire workforce.
The precision comes from the Talent Tree itself. Each Node expands into 12 Branches, and each Branch into 12 Sub-Branches, allowing Stories to be tagged at a much more meaningful level than a conventional list of soft skills. Stories then retain Details, Evidence, and Data and can be associated with Stories elsewhere in the Tree.
| Which Skills Are Most Demonstrated? Explore the depth of evidence behind specific Human Skills. A capability repeatedly demonstrated across Activities, Roles, feedback, and outcomes tells a different story from one appearing only occasionally or through self-description. This view can distinguish different levels of demonstrated experience using whatever evidence and proficiency framework is appropriate to the organization. The goal isn’t to declare that someone simply “has” or “doesn’t have” a human capability. It is to show how much relevant evidence currently supports our understanding of it. | Which Human Skills Matter in Different Roles? Connect Human Skill Sub-Branches directly to the Roles in which they are expected or demonstrated. A manager might rely heavily on Coaching, Delegation, Feedback, Conflict Navigation, and Goal Maintenance. A salesperson may repeatedly demonstrate Active Listening, Rapport Building, Perspective Taking, Negotiation, and Questioning. A Product Manager may depend on Facilitation, Prioritization, Adaptability, and Decision Communication. This reveals the human capability anatomy of a Role rather than attaching a generic list of competencies to a title. | What Human Skills Power Different Activities? Connect specific Human Skills to the Activities where they are actually used. Client Discovery might involve: Active Listening → Questioning → Perspective Taking → Empathy Strategy Planning might depend on: Facilitation → Perspective Taking → Prioritization → Decision Communication Project Delivery might repeatedly require: Coordination → Adaptability → Reliability → Conflict Navigation This is one of the most important views in the Human Skills Gallery because Activities provide observable context for capability. The Tree’s broader architecture is designed to connect what people do with the capabilities and other Stories associated with those experiences. | How Do Human Skills Differ Across Teams? Compare the human capability mix of different teams, functions, departments, projects, or other organizational groups. A Customer Success team may demonstrate a different concentration of Listening, Empathy, Conflict Navigation, and Relationship skills than an Engineering group. Product may show particularly strong Facilitation and cross-functional collaboration. Operations may rely heavily on Prioritization, Reliability, and Adaptability. The purpose isn’t to determine which team has “better” Human Skills. It is to understand the different capability profiles required by different forms of work. |
| Which Human Skills Travel Furthest? Identify Human Skill Sub-Branches demonstrated across the widest range of Roles, teams, and Activities. Capabilities such as Active Listening, Adaptability, Collaboration, Perspective Taking, Facilitation, or Decision-Making may prove highly transferable across otherwise very different professional contexts. This can help organizations recognize portable human capability—skills that enable internal mobility, collaboration, leadership transitions, and adaptation to new forms of work. It also gives TalentSync another way to recognize value that a job-title-based system can easily miss. | Which Human Skills Work Together? See the Human Skill combinations that repeatedly appear together in real experiences. Active Listening + Perspective Taking + Questioning might form a recurring pattern in customer discovery. Facilitation + Conflict Navigation + Decision Communication may appear together in cross-functional leadership. Coaching + Feedback + Emotional Awareness might characterize effective development conversations. These recurring combinations create capability clusters that can be more useful than evaluating each Human Skill independently. Because Talent Tree Stories can be associated across the graph, these larger patterns can emerge from the relationships between individual experiences. | Where Are Human Skills Being Recognized? Understand where the evidence supporting Human Skills is coming from. Human capability may become visible through Activities, peer recognition, manager feedback, customer feedback, outcomes, assessments, credentials, or other appropriately connected evidence. This is especially important for Human Skills because they are often difficult to demonstrate through a certificate or work artifact alone. A person’s ability to facilitate, coach, listen, negotiate, adapt, or navigate conflict may become most credible when multiple kinds of evidence converge around repeated experiences. | Which Human Skills Are Growing? Track changes in demonstrated Human Skills over time. Coaching may increase as more people take on leadership responsibilities. Facilitation may spread as cross-functional work expands. Adaptability may become increasingly visible during organizational transformation. Perspective Taking may grow through customer-facing work. This transforms Human Skills from a static assessment into a developmental record of capability. Because Talent Tree Stories accumulate over time, new experiences can continually add context and evidence rather than forcing a person’s capability into a permanent score. |
Which Human Skills Drive Outcomes?
Connect Human Skills with the Activities and outcomes in which they appear.
Active Listening may be associated with stronger customer discovery. Facilitation may appear in Activities that reach decisions faster. Coaching may accompany employee development outcomes. Deadline Management may contribute to delivery reliability. Conflict Navigation may appear in successful cross-functional work.
The important claim isn’t that one Human Skill single-handedly caused an outcome. Instead, TalentSync can make the chain of associated evidence visible:
Human Skill → Role → Activity → Contribution → Outcome
That distinction matters. Cross-story attribution in the Talent Tree is designed to describe relationships between experiences—including dimensions such as time, significance, growth, confidence, challenge, and connection strength—rather than collapsing complex human contribution into a single unexplained score.
Together, these Gallery Stories demonstrate something fundamentally different from a conventional soft-skills assessment.
TalentSync can move between:
Broad capability domains
↓
Specific Human Skill Sub-Branches
↓
The Roles where they are used
↓
The Activities where they are demonstrated
↓
The evidence supporting them
↓
The outcomes with which they are associated
That makes the 12×12 structure a tagging mechanism for real organizational experience, not simply a taxonomy for categorizing people.
A single Activity can be associated with several precise Human Skills. A single Role can reveal a recurring capability pattern. Similar Activities can be grouped to show what Human Skills that kind of work tends to require. Teams can be compared. Expected capability can be compared with demonstrated capability. And the same skill can be followed across Roles, Activities, teams, and time.
The result is a living picture of how human capability is actually being applied across the organization, where it is concentrated, where it is transferable, and where important capabilities may need to be developed or better recognized.
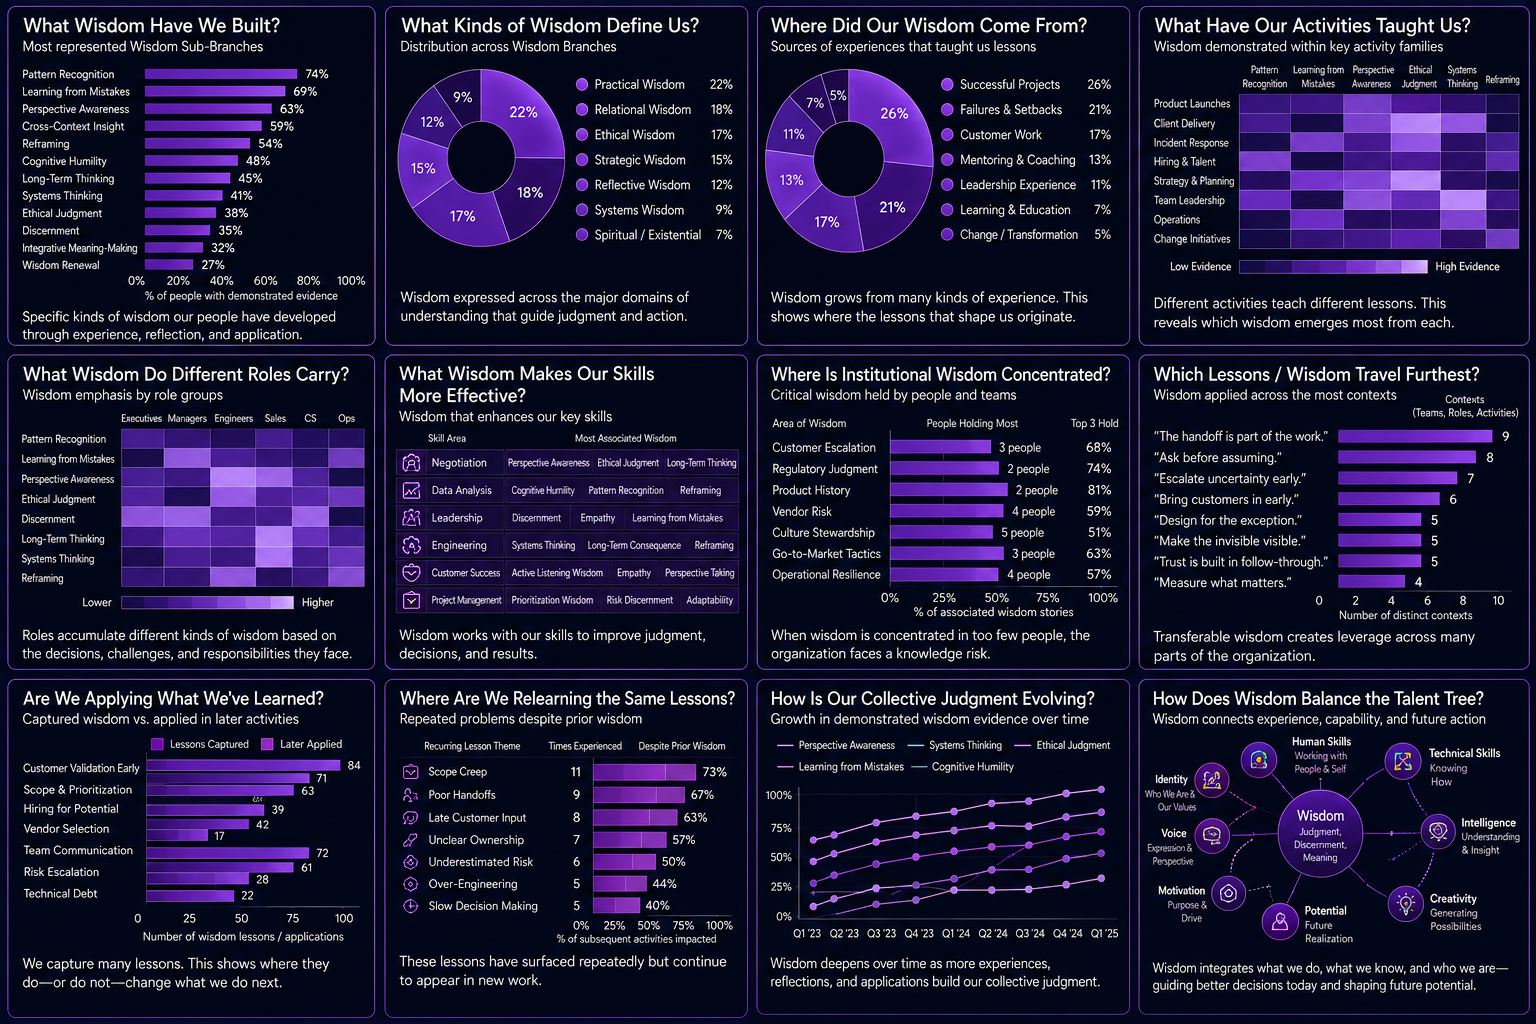
Explore Wisdom Through Gallery Stories
Gallery Stories turn Wisdom data into a living picture of what an organization has learned through experience—and how that understanding shapes judgment, action, and future decisions. Wisdom in the Talent Tree is not just abstract knowledge. It emerges from what people have done, what happened as a result, how they reflected on it, and what they carried forward into later Roles, Activities, decisions, and relationships.
In practice, Wisdom Stories can be highly specific: a phrase, principle, lesson, or insight that takes on meaning because people repeatedly learn it, reference it, apply it, and pass it on. The Tree’s taxonomy helps classify what kind of Wisdom a Story represents, while the Story itself retains the lived meaning, evidence, and associations that make it useful. Every Story can carry Details, Evidence, and Data and can be connected across the Tree to related experiences and capabilities.
The examples below show some of the ways Combined Wisdom data can be explored—from the kinds of judgment an organization has developed to where its lessons came from, where wisdom is concentrated, which lessons travel across contexts, and whether people are actually applying what they have learned.
What Wisdom Have We Built?
See the specific kinds of Wisdom most strongly evidenced across the organization.
Rather than relying on vague labels such as “strategic wisdom,” this view can surface more precise forms of judgment such as Pattern Recognition, Learning from Mistakes, Perspective Awareness, Cross-Context Insight, Reframing, Cognitive Humility, Long-Term Thinking, Systems Thinking, Ethical Judgment, and Discernment.
These signals can be grounded in associated experiences, reflections, later applications, and outcomes rather than treated as abstract traits.
| What Kinds of Wisdom Define Us? Roll specific Wisdom Stories up into broader Wisdom Branches to understand the overall shape of organizational judgment. This might reveal concentration in practical, relational, ethical, strategic, reflective, systems-oriented, or other Wisdom domains defined by the Talent Tree. The purpose is not to declare one kind of Wisdom better than another. It is to show what forms of understanding the organization has accumulated most strongly through experience. | Where Did Our Wisdom Come From? See the kinds of experiences that produced the lessons people now carry. Wisdom may grow from: successful projects failures and setbacks customer work leadership experience mentoring and coaching formal learning organizational change conflict experimentation This is important because Wisdom is not simply acquired through instruction. It often emerges through experience interpreted over time. | What Have Our Activities Taught Us? Connect Activity families to the kinds of Wisdom they most frequently generate. Product launches may produce strong Pattern Recognition and Learning from Mistakes. Incident response may cultivate Systems Thinking and Long-Term Consequence. Hiring may generate Perspective Awareness and Ethical Judgment. Strategy work may repeatedly produce Reframing and Cross-Context Insight. This creates an organizational learning map: What are different kinds of work actually teaching us? Because the Talent Tree allows Stories to associate across Nodes, Activities can become the experiential source for later Wisdom Stories rather than remaining isolated records of what happened. | What Wisdom Do Different Roles Carry? Explore the kinds of judgment accumulated through different Roles. Executives, managers, engineers, customer-facing teams, operators, educators, advisors, and other Roles encounter different types of uncertainty, responsibility, tradeoffs, and consequences. Over time, those experiences can create distinct Wisdom patterns. The point is not that a Role automatically makes someone wise. It is that the experiences associated with that Role can reveal what kinds of understanding people have actually developed through doing the work. |
| What Wisdom Makes Our Skills More Effective? Connect Wisdom with Technical and Human Skills to show how judgment changes the way capability is applied. A Technical Skill such as Data Analysis becomes more useful when paired with: Cognitive Humility Pattern Recognition Perspective Awareness Long-Term Thinking A Human Skill such as Negotiation may become more effective when paired with: Discernment Ethical Judgment Perspective Taking Long-Term Relationship Thinking This is one of the most important distinctions in the Tree: Skill tells us what someone can do. Wisdom helps explain how, when, and why they choose to do it. That makes Wisdom an integrative layer between capability and judgment. Where Is Institutional Wisdom Concentrated? See where critical organizational understanding is held by relatively few people or teams. Examples might include: customer escalation judgment regulatory understanding product history vendor risk culture stewardship go-to-market lessons operational resilience This reveals a different kind of organizational dependency than a skills gap. A company may have several people capable of performing the work while only one or two hold the deep contextual understanding of why things are done the way they are. That is institutional-memory risk. | Which Lessons and Wisdom Travel Furthest? Identify specific Wisdom Stories that prove useful across many different contexts. For example: “The handoff is part of the work.” might appear in Engineering, Customer Success, Recruiting, Finance, onboarding, and project delivery. “Ask before assuming.” may be referenced in customer discovery, leadership, design, sales, and conflict resolution. The value of the phrase is not simply that people like it. Its importance grows when it is associated with different Roles, Activities, teams, and later applications. This allows TalentSync to begin measuring the transferability of Wisdom. | Are We Applying What We’ve Learned? Compare captured Wisdom with later Activities that demonstrate the lesson being put into practice. An organization may repeatedly identify the need to involve customers earlier, clarify scope before execution, escalate uncertainty sooner, or improve handoffs. The important question is: Did later behavior change? This view distinguishes between: lesson captured and lesson embedded into practice That makes organizational learning visible in a way a retrospective document or knowledge base rarely can. | Where Are We Relearning the Same Lessons? Surface recurring problems that continue appearing despite prior Wisdom Stories. Repeated scope creep, poor handoffs, late customer input, unclear ownership, underestimated risk, over-engineering, or slow decision-making may indicate that a lesson has been recognized but not consistently integrated into operating behavior. This Gallery Story is not intended to assign blame. It highlights a gap between: what the organization already knows and what the organization consistently does That gap can become a valuable target for learning, process design, leadership, or structural change. |
| How Is Our Collective Judgment Evolving? Track changes in demonstrated Wisdom over time. Patterns such as Perspective Awareness, Systems Thinking, Ethical Judgment, Learning from Mistakes, Cognitive Humility, or Cross-Context Insight may become more visible as people encounter new Roles, challenges, and responsibilities. This turns Wisdom into a developmental organizational record, not a static assessment. As new experiences occur, older lessons may also evolve, deepen, or be revised. | How Does Wisdom Balance the Talent Tree? Wisdom sits at an especially important point in the Combined Talent Tree because it helps interpret what the rest of the Tree means. Activities show what happened. Roles show the context in which people participated. Human and Technical Skills show what capabilities were applied. Voice shows how ideas and understanding were expressed. Motivation and Identity help explain why people acted and how they understood themselves. Wisdom connects those experiences into judgment and meaning—and then helps inform Creativity, Intelligence, and Potential above it. | This is where the Talent Tree becomes more than a map of capability. It becomes a map of what experience has taught the organization about how to act well. And some of the most valuable Wisdom Stories may be remarkably simple: “Ask before assuming.” “Escalate uncertainty early.” “The handoff is part of the work.” “Bring customers in sooner.” “Design for the exception.” “Trust is built in the follow-through.” | What makes these meaningful is not the phrase alone. TalentSync can connect each one to the experiences that taught it, the people and Roles that carry it, the Activities where it is applied, the Skills it informs, and the outcomes that followed. That creates a powerful organizational cycle: Experience → Reflection → Wisdom → Expression → Application → New Experience → Refined Wisdom The result is a living map of what the organization has learned, what it keeps coming back to, what knowledge may be at risk of disappearing, and whether those lessons are actually helping people make better decisions over time. |
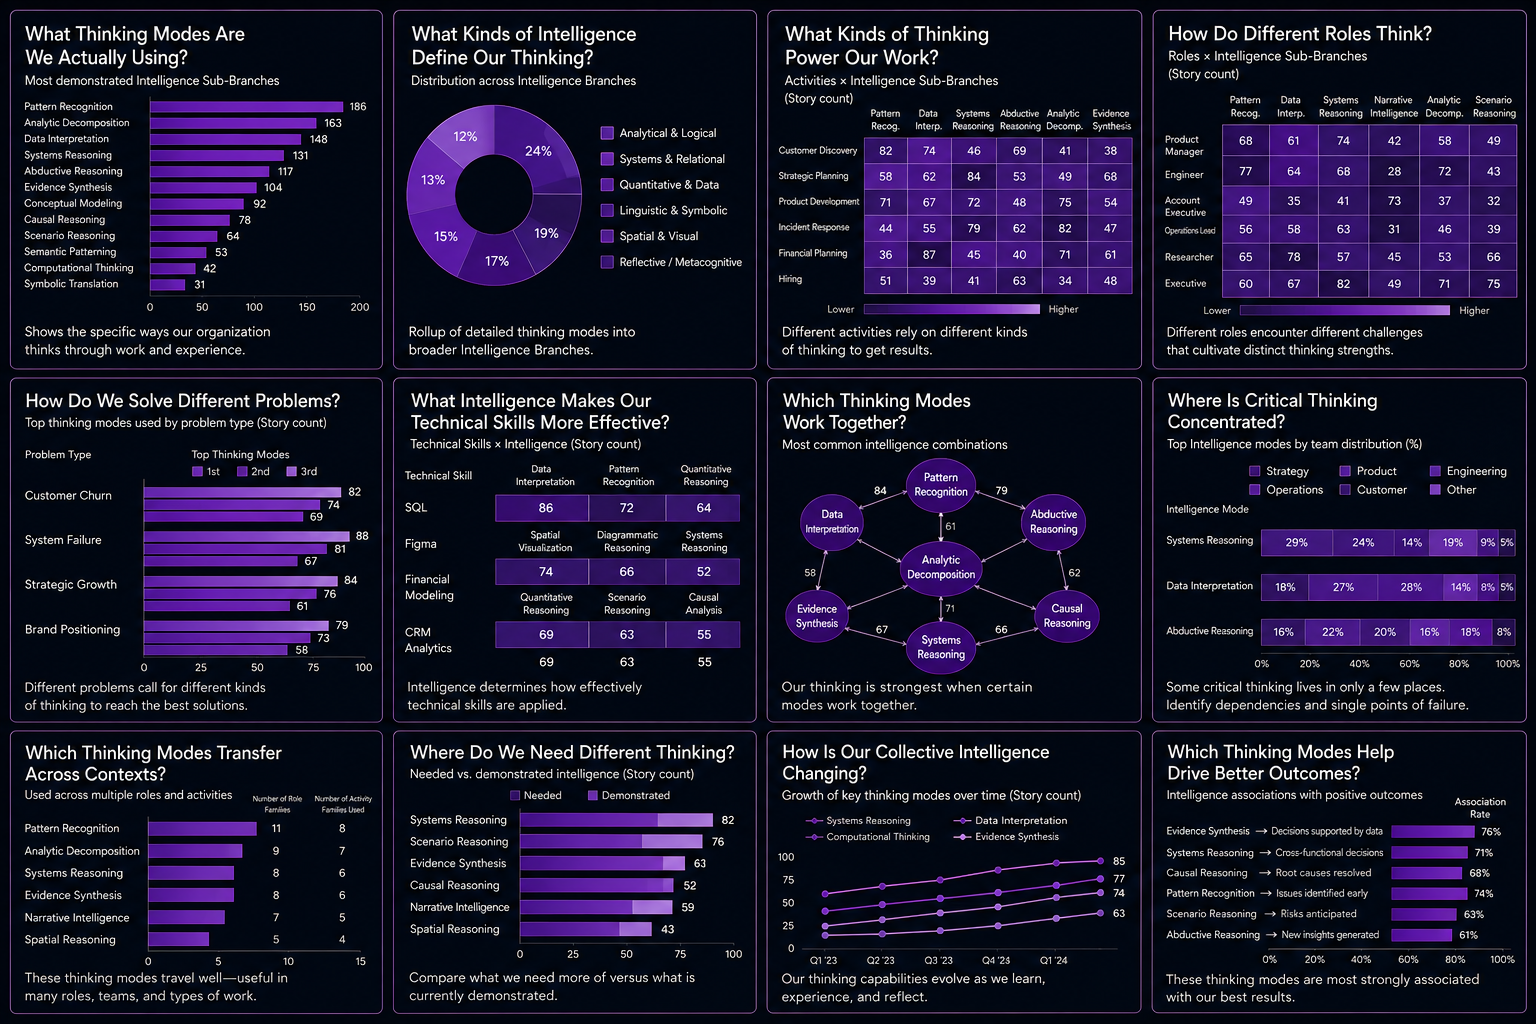
Explore Intelligence Through Gallery Stories
Gallery Stories turn Intelligence data into a detailed picture of how an organization thinks. Rather than trying to assign people a generalized measure of intelligence, TalentSync can reveal the specific forms of reasoning being demonstrated through real Roles, Activities, problems, decisions, and outcomes.
In the Talent Tree, Intelligence represents the architecture of thought: the ways people analyze information, recognize patterns, break apart complex problems, interpret evidence, model systems, reason through uncertainty, and construct understanding. The broader Tree is specifically designed to capture not only what people have done, but the cognitive processes and relationships underlying experience.
The examples below are Gallery templates, not fixed dashboards. They demonstrate how Intelligence Stories can be aggregated and associated with other parts of the Tree to explore an individual, team, department, project group, candidate pool, learning cohort, or entire organization.
Because the Talent Tree follows a Node → Branch → Sub-Branch → Story structure, Intelligence can be examined at multiple levels: broad forms of cognition, highly specific thinking modes, and the actual experiences through which those modes were demonstrated.
| What Thinking Modes Are We Actually Using? See the specific Intelligence Sub-Branches most frequently demonstrated through work and experience. Rather than simply saying an organization is “analytical,” TalentSync can surface much more precise patterns such as Pattern Recognition, Analytic Decomposition, Data Interpretation, Systems Reasoning, Abductive Reasoning, Evidence Synthesis, Conceptual Modeling, Causal Reasoning, Scenario Reasoning, Semantic Patterning, Computational Thinking, or Symbolic Translation. This provides a detailed vocabulary for understanding: How are our people actually thinking when they do their work? As more Stories are captured, these specific cognitive patterns can be aggregated without reducing them to a single intelligence score. | What Kinds of Intelligence Define Our Thinking? Roll detailed Intelligence Sub-Branches upward into broader Branches to understand the overall composition of organizational thinking. An organization might demonstrate strong concentrations of analytical and logical reasoning, systems thinking, quantitative interpretation, linguistic and symbolic reasoning, spatial and visual thinking, or reflective and metacognitive processing. This gives leaders a high-level view while retaining the ability to drill all the way back down to the Stories underneath it. The Tree’s 12×12 structure is specifically intended to provide this combination of broad organization and detailed vocabulary. | What Kinds of Thinking Power Our Work? Connect Intelligence directly with Activities to understand the reasoning patterns different kinds of work require and demonstrate. Customer Discovery might draw heavily on: Pattern Recognition + Abductive Reasoning + Evidence Synthesis Incident Response might emphasize: Analytic Decomposition + Causal Reasoning + Systems Reasoning Strategic Planning might combine: Systems Reasoning + Scenario Reasoning + Evidence Synthesis Financial Planning may rely more heavily on: Data Interpretation + Quantitative Reasoning + Conceptual Modeling The important insight is that Intelligence is not occurring separately from work. Activities provide the context in which thinking becomes observable. | How Do Different Roles Think? Explore the Intelligence patterns associated with different Roles. An Engineer may frequently demonstrate Analytic Decomposition, Causal Reasoning, and Systems Reasoning. A Product Manager might combine Systems Reasoning, Pattern Recognition, and Evidence Synthesis. A researcher may demonstrate particularly strong Data Interpretation and Abductive Reasoning. An Account Executive may rely more heavily on Narrative Intelligence, Pattern Recognition, and contextual interpretation. These aren’t assumptions based simply on job titles. They can emerge from the Stories and Activities actually associated with people performing those Roles. That creates a more meaningful picture of a Role: not only what responsibilities it carries, but what kinds of thinking the work actually calls upon. |
| How Do We Solve Different Problems? Different problems call for different cognitive approaches. A customer-retention problem may require Pattern Recognition, Abductive Reasoning, and Data Interpretation. A technical failure may require Analytic Decomposition, Causal Reasoning, and Systems Reasoning. A strategic-growth problem may depend more heavily on Systems Reasoning, Scenario Reasoning, and Evidence Synthesis. A positioning challenge may involve Semantic Patterning, Narrative Intelligence, and Comparative Reasoning. This Gallery Story helps an organization see its problem-solving repertoire: When we encounter different kinds of challenges, what forms of thinking are we actually bringing to them? Over time, this can also reveal where teams repeatedly approach very different problems with the same cognitive methods—and where introducing a different form of reasoning might be useful. | What Intelligence Makes Our Technical Skills More Effective? Connect Intelligence with Technical Skills to distinguish knowing how to use something from knowing how to think with it. Someone may know SQL, for example, while their work also demonstrates: Data Interpretation Pattern Recognition Quantitative Reasoning Someone working in Figma might demonstrate: Spatial Visualization Diagrammatic Reasoning Systems Reasoning Financial Modeling might combine technical proficiency with: Quantitative Reasoning Scenario Reasoning Causal Analysis This is an important distinction within the Talent Tree. Technical Skills describe capabilities and knowledge. Intelligence helps reveal the cognitive processes being applied through those capabilities. Because Stories can be cross-linked throughout the Tree, the same experience can provide context for both. | Which Thinking Modes Work Together? Intelligence rarely operates one reasoning process at a time. Pattern Recognition may repeatedly appear alongside Abductive Reasoning and Data Interpretation. Systems Reasoning may frequently combine with Causal Reasoning and Scenario Reasoning. Narrative Intelligence may work alongside Semantic Patterning and Symbolic Translation. These recurring associations can reveal cognitive combinations—patterns of thinking that repeatedly appear together when people solve particular kinds of problems. Instead of asking only: “Which thinking mode do we have?” TalentSync can begin asking: “Which combinations of thinking repeatedly work together in our real experiences?” The Tree’s cross-story attribution and association model is designed precisely to turn otherwise disconnected records into these larger graphs of meaning. | Where Is Critical Thinking Concentrated? See where important forms of reasoning are distributed across teams, functions, Roles, or other groups. Systems Reasoning may be strongly concentrated in Strategy and Product. Data Interpretation may be widely distributed across Product, Engineering, Finance, and Operations. Abductive Reasoning may be particularly visible in Research, Customer Success, and problem-solving Roles. This can expose an important organizational dependency: What kinds of thinking would become scarce if a particular team or group disappeared? That is different from a Technical Skill gap. The organization may have people who know the relevant tools while still depending on relatively few people for particular forms of reasoning. |
| Which Thinking Modes Transfer Across Contexts? Identify Intelligence Sub-Branches that repeatedly appear across different Roles, Activities, teams, and problem types. Pattern Recognition may appear across eleven Role families. Analytic Decomposition might appear across nine. Systems Reasoning may travel from Engineering into Operations, Product, Strategy, and leadership. These become portable cognitive capabilities. That can be particularly valuable for discovering talent hidden by conventional job titles. Someone working in Customer Support, for example, may repeatedly demonstrate: Pattern Recognition Abductive Reasoning Classification Systems Reasoning Data Interpretation Those thinking patterns may also be valuable in Research, Operations, Product, Quality Assurance, or Analytics. A traditional system might primarily see: Customer Support Specialist. The Talent Tree can potentially see the transferable architecture of thinking demonstrated underneath that Role. | Where Do We Need Different Thinking? Compare the Intelligence modes expected by a Role, Activity, project, strategy, or organizational framework with those currently being demonstrated. A strategic initiative might require more: Systems Reasoning Scenario Reasoning Evidence Synthesis A complex operational environment may call for additional: Causal Reasoning Analytic Decomposition Pattern Recognition A customer-facing transformation may benefit from stronger: Narrative Intelligence Perspective Integration Abductive Reasoning This gives TalentSync a more nuanced form of gap analysis. The question is not: “Who isn’t intelligent enough?” It is: “What kinds of thinking does this work require, and where do we currently have evidence of those capabilities?” That distinction is essential. | How Is Our Collective Intelligence Changing? Track changes in demonstrated thinking patterns over time. Systems Reasoning may increase as teams take on more complex cross-functional work. Computational Thinking may grow as automation becomes more prevalent. Evidence Synthesis may become more common as teams adopt more data-informed decision processes. Scenario Reasoning may increase during periods of uncertainty or transformation. This allows Intelligence to be treated as developmental rather than fixed. New Roles create new cognitive demands. New Activities provide new opportunities to practice. New problems generate new evidence. Over time, the Combined Tree can show how the organization’s collective ways of thinking are evolving. | Which Thinking Modes Help Drive Better Outcomes? Connect Intelligence Stories with Activities and the outcomes associated with them. Evidence Synthesis may frequently appear in decisions supported by stronger information. Causal Reasoning may appear in Activities where root problems are successfully identified. Pattern Recognition may be associated with issues detected earlier. Systems Reasoning may accompany successful cross-functional decisions. Scenario Reasoning may appear in Activities where risks were anticipated before they became problems. These relationships should be interpreted as associations, not simplistic claims of causation. TalentSync can preserve the evidence chain: Intelligence → Activity → Contribution → Outcome while retaining the surrounding Roles, Skills, context, evidence, and other Stories that contributed to what happened. Cross-story attribution is explicitly designed to capture directional relationships and dimensions such as Time, Significance, Challenge, Growth, Confidence, and Connection Strength rather than stripping an experience down to a single metric. |
From Individual Intelligence to Collective Intelligence
Together, these Gallery Stories reveal something larger than a catalog of cognitive skills.
An organization does not think through one mind.
A researcher may contribute Evidence Synthesis.
An analyst may contribute Data Interpretation.
An engineer may contribute Causal Reasoning.
A designer may contribute Spatial and Diagrammatic Reasoning.
A strategist may contribute Systems and Scenario Reasoning.
A customer-facing team member may contribute Pattern Recognition and contextual insight that nobody else has access to.
The intelligence of the organization can therefore emerge partly from how different ways of thinking combine around shared problems.
That gives TalentSync the ability to explore questions conventional talent systems rarely ask:
What kinds of thinking do we have?
Where are they being demonstrated?
Which Roles and Activities develop them?
Which thinking modes complement one another?
Where are important modes concentrated?
Which capabilities transfer into completely different work?
What kinds of thinking are missing from the problems we’re trying to solve?
And what happens when different forms of intelligence come together?
This is also why Intelligence becomes such an important balancing layer in the Talent Tree. The Tree is designed as an interconnected system rather than a collection of isolated categories: Roles provide context, Activities capture experience, Technical and Human Skills describe capability, Wisdom captures learned understanding and judgment, and Intelligence helps describe how information and experience are cognitively processed and connected.
The result is not a system for deciding who is smartest.
It is a system for understanding how people think through real work—and how those different forms of thinking combine into collective organizational intelligence.
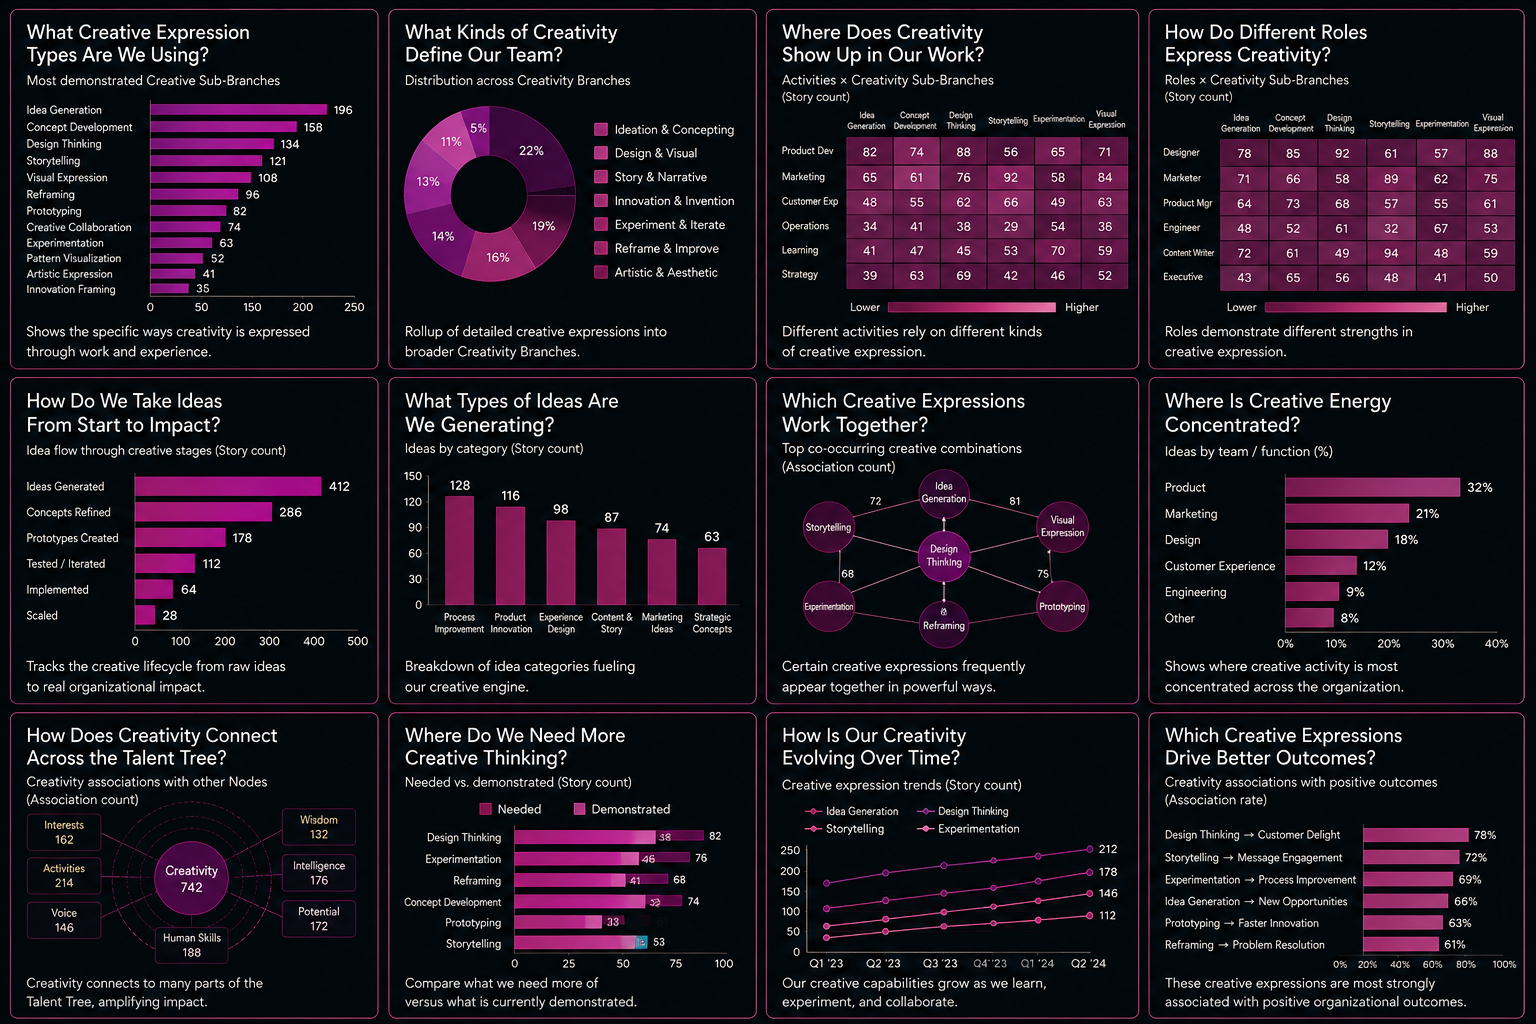
Explore Creativity Through Gallery Stories
Gallery Stories turn Creativity data into a living picture of how an organization generates ideas, experiments, reframes problems, creates new forms, and turns imagination into something real.
Creativity in the Talent Tree is much broader than artistic talent. It represents the capacity to generate, synthesize, and express novel ideas, patterns, and systems that expand the possible—connecting insight and intuition with structure, expression, experimentation, and creation.
That means Creativity Stories can emerge almost anywhere: a new product concept, an unconventional solution to an operational problem, a marketing narrative, an experimental process, a prototype, a visual design, a new framework, a collaborative brainstorm, or a small improvement that changes how work gets done.
The examples below are Gallery templates, not fixed dashboards. They demonstrate how Creativity Stories can be grouped, filtered, and associated across the Combined Talent Tree to understand an individual, project, team, department, learning cohort, creative community, or entire organization.
| What Creative Expression Types Are We Using? See the specific Creativity Sub-Branches most frequently demonstrated through real work and experience. Rather than reducing Creativity to a single label, TalentSync can surface specific forms such as Idea Generation, Concept Development, Design Thinking, Storytelling, Visual Expression, Reframing, Prototyping, Creative Collaboration, Experimentation, Pattern Visualization, Artistic Expression, and Innovation Framing. This provides a much more useful question than: “Are we creative?” Instead: How is creativity actually showing up here? The detailed Creativity taxonomy supports this precision, distinguishing concepts such as Divergent Thinking, Conceptual Exploration, Reframing, Analogical Thinking, Visionary Ideation, Cognitive Play, Intuitive Generation, and other specific creative processes. | What Kinds of Creativity Define Our Team? Roll detailed Creativity Stories upward into broader Creativity Branches. An organization might show strong concentrations of Ideation & Concepting, Design & Visual Creation, Story & Narrative, Innovation & Invention, Experimentation & Iteration, Collaborative Creativity, or Artistic & Aesthetic Expression. This lets leaders zoom between two useful levels: What broad forms of Creativity characterize us? and: What specific creative behaviors and expressions sit underneath them? The 12×12 structure makes both views possible without flattening creative expression into one generic competency. | Where Does Creativity Show Up in Our Work? Connect Creativity directly with Activities. Product Development might generate high levels of Design Thinking, Concept Development, Prototyping, and Experimentation. Marketing might strongly demonstrate Storytelling, Visual Expression, and Idea Generation. Customer Experience could involve Reframing, Service Design, Concept Development, and Storytelling. Operations may reveal another form of Creativity entirely: process redesign, constraint-based innovation, experimentation, and incremental improvement. This matters because Creativity isn’t confined to formally “creative” work. Creativity can be observed through the Activities where people make something different, improve something existing, or discover another way forward. The broader Talent Tree model explicitly treats Activities as the concrete experiences through which Creativity and other higher-order capabilities become visible. | How Do Different Roles Express Creativity? Explore the different forms of Creativity demonstrated through different Roles. A Designer might strongly demonstrate: Visual Expression + Design Thinking + Concept Development A Marketer might emphasize: Storytelling + Idea Generation + Reframing A Product Manager could combine: Concept Development + Design Thinking + Collaborative Creativity An Engineer may demonstrate: Experimentation + Prototyping + Problem Reframing An Executive might show Creativity through: Visionary Ideation + Strategic Reframing + Conceptual Innovation The purpose isn’t to decide which Role is “most creative.” It is to understand that different Roles create different opportunities for creativity to take form. |
| How Do We Take Ideas From Start to Impact? Follow the creative lifecycle from possibility to implementation. For example: Ideas Generated ↓ Concepts Refined ↓ Prototypes Created ↓ Tested & Iterated ↓ Implemented ↓ Scaled This gives TalentSync a way to examine something organizations often struggle to see: What happens to our ideas after we have them? A team may generate hundreds of ideas but prototype very few. Another may generate fewer ideas but rapidly test and implement them. Neither pattern is automatically better. The visualization reveals how creative energy moves through the organization and where ideas tend to progress, change, or stop. The Creativity taxonomy explicitly includes Experimental Iteration, Creative Risk-Taking, Disruptive Innovation, and Transformative Experimentation, making experimentation itself part of the creative process rather than merely something that happens after creation. | What Types of Ideas Are We Generating? See what organizational creativity is actually focused on. Ideas might concern: Process Improvement Product Innovation Experience Design Content & Story Marketing Ideas Strategic Concepts Another organization could use completely different categories. This provides a simple view of the organization’s creative attention. Are most ideas focused on products? Internal processes? Customer experiences? New narratives? Entirely new business models? Because Creativity Stories can connect with Interests, Activities, Roles, and other Nodes, TalentSync can provide context around not simply how many ideas exist, but what people are trying to change or create. | Which Creative Expressions Work Together? Creativity rarely operates through a single process. Idea Generation may repeatedly connect with Design Thinking. Design Thinking may connect with Prototyping and Experimentation. Storytelling may combine with Visual Expression. Reframing may unlock entirely new Idea Generation. These recurring associations reveal creative combinations—patterns of creative behavior that frequently occur together. This is especially important for collective creativity. The taxonomy explicitly describes creativity that emerges through Co-Creation, Collective Improvisation, Distributed Creativity, Dialogue-Based Creation, Cross-Disciplinary Coherence, Mutual Inspiration, Feedback Integration, and Collective Innovation. So Creativity isn’t merely something individuals possess. It can emerge between people. | Where Is Creative Energy Concentrated? See where Creativity Stories are appearing across teams, functions, projects, or other organizational groups. Product may account for a large share of documented creative activity, followed by Marketing and Design. But Creativity may also be emerging in less obvious places: Operations redesigning a process. Customer Success inventing a better service model. Engineering finding an unconventional solution. HR redesigning onboarding. Finance developing a new forecasting method. This view can reveal whether creative activity is distributed throughout the organization or concentrated in the teams officially expected to innovate. That distinction can matter enormously for recognizing hidden contribution. |
| How Does Creativity Connect Across the Talent Tree? Creativity is one of the most interconnected Nodes in the entire Talent Tree. Interests can supply curiosity and subject matter. Activities provide places to experiment and make. Voice provides expression. Human Skills enable collaboration and co-creation. Technical Skills provide tools and craft. Intelligence provides reasoning, synthesis, and pattern recognition. Wisdom helps determine which possibilities are meaningful or appropriate. Potential represents where those new possibilities might lead. This is why Creativity should not be understood in isolation. The Talent Tree’s architecture is intentionally relational: Stories can connect across Nodes, allowing one experience to contribute simultaneously to a larger narrative of capability, expression, learning, and growth. | Where Do We Need More Creative Thinking? Compare the forms of Creativity required by a Role, Activity, strategy, challenge, or organizational objective with those currently being demonstrated. A transformation initiative might require more: Design Thinking Experimentation Reframing A product organization might need: Concept Development Prototyping Cross-Disciplinary Creation A communications challenge could require: Storytelling Visual Expression Narrative Reframing This turns “we need more innovation” into a much more useful question: What kind of Creativity do we actually need—and where do we currently have evidence of it? The result is not a judgment about whether people are creative enough. It is a map of creative capability relative to the work ahead. | How Is Our Creativity Evolving Over Time? Track different forms of creative expression as they grow, decline, or change. Idea Generation may increase as new innovation programs begin. Experimentation may rise as teams adopt prototyping practices. Storytelling might grow as the organization develops its external Voice. Design Thinking may spread from Product into Operations, HR, or Customer Success. This treats Creativity as developmental and dynamic, not a fixed personality trait. The taxonomy’s Meta-Creative Reflection branch reinforces this idea by explicitly including Creative Self-Awareness, Process Analysis, Meta-Feedback Integration, Cross-Context Reflection, Lifelong Creative Evolution, and Integrative Reflection. Organizations can therefore examine not just what they create, but how their creative practices themselves are changing. | Which Creative Expressions Drive Better Outcomes? Connect Creativity Stories with the Activities and outcomes in which they appear. Design Thinking may frequently appear in work associated with stronger customer experiences. Storytelling may accompany stronger message engagement. Experimentation may appear in successful process improvements. Idea Generation may be associated with new opportunities. Prototyping may accompany faster innovation cycles. Reframing may appear in Activities where previously difficult problems are resolved. These should be interpreted as associations rather than simplistic claims of causation. The richer story is: Creative Expression → Activity → Contribution → Outcome with the Roles, Skills, Intelligence, Wisdom, Voice, evidence, and other contextual Stories preserved around it. |
From Individual Creativity to a Creative Organization
Together, these Gallery Stories allow TalentSync to explore Creativity at several levels:
What forms of Creativity exist?
Where are they being expressed?
Which Roles and Activities draw upon them?
What kinds of ideas are people generating?
Which creative processes work together?
Where is creative activity concentrated?
What happens to ideas after they’re generated?
What creative capabilities does upcoming work require?
How are creative practices evolving?
And what happens when ideas become action?
That produces a much richer picture than simply labeling someone—or an organization—“creative.”
An organization can have tremendous creative capacity but weak implementation.
Another may excel at incremental improvement while rarely producing radical ideas.
A team may generate powerful concepts but lack the Technical Skills needed to prototype them.
Another may have the Technical Skills and Intelligence required to build almost anything but lack enough Reframing, Experimentation, or divergent ideation to imagine alternatives.
The Combined Talent Tree lets those relationships become visible.
Creativity therefore becomes the point where much of the Tree begins to generate something that did not exist before.
Interests provide curiosity.
Experience provides material.
Skills provide capability.
Intelligence connects and processes.
Wisdom provides perspective and judgment.
Creativity recombines them into possibility.
Potential asks where that possibility could lead next.
That is why the source describes Creativity as the bridge between thought and form, knowing and making, imagination and transformation.
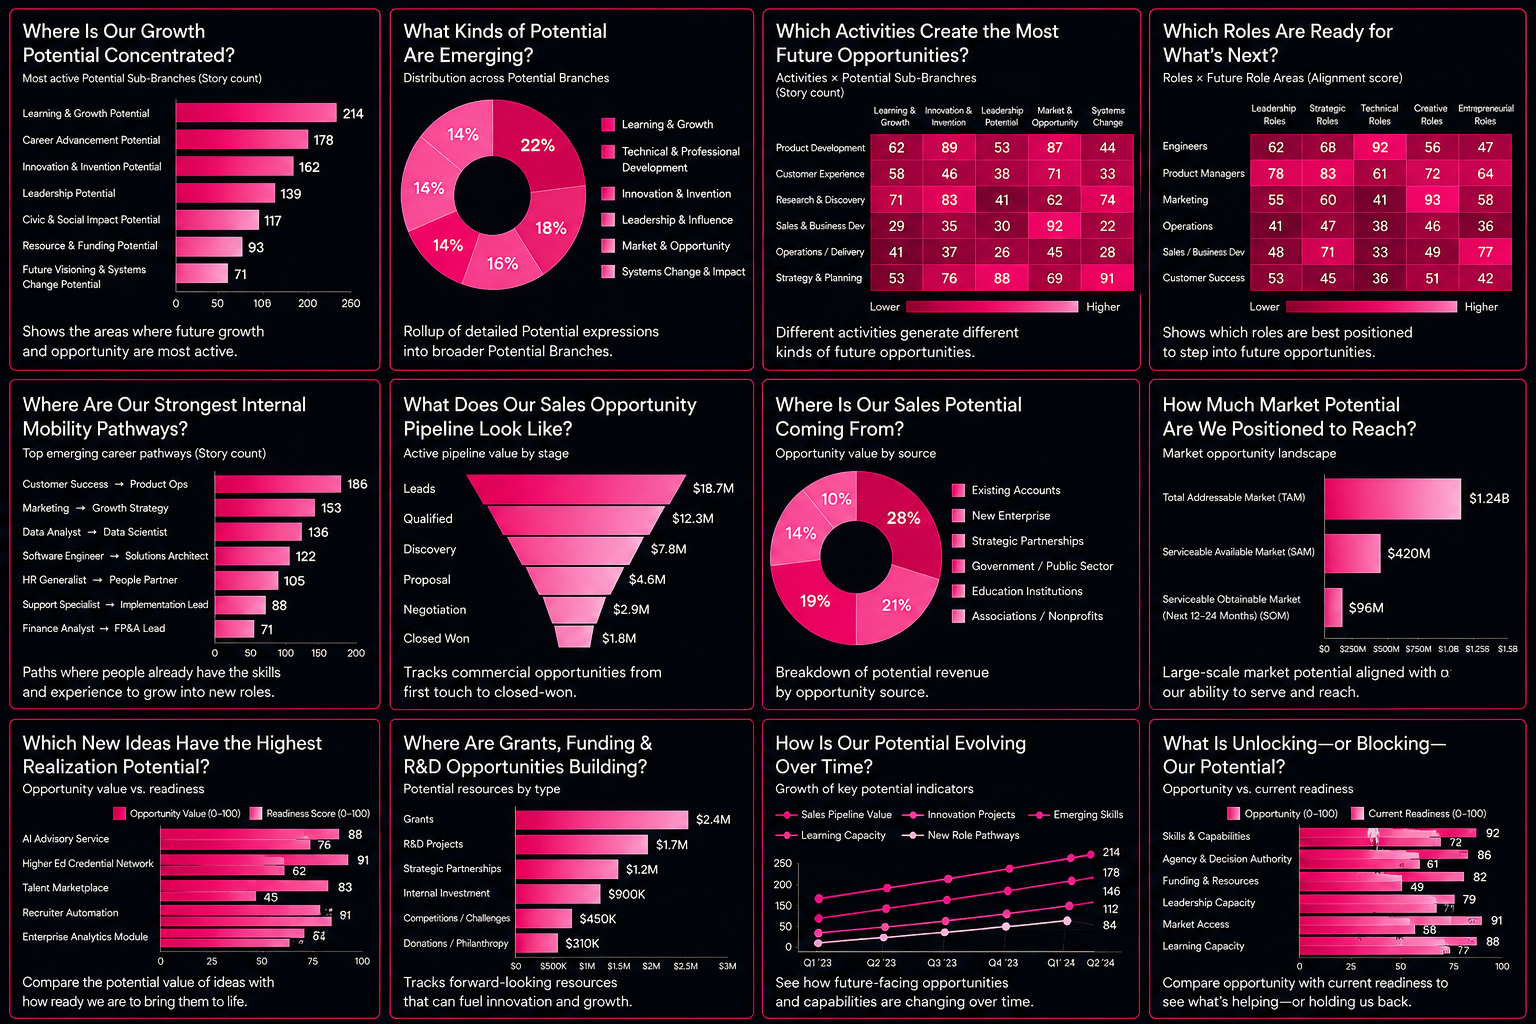
Explore Potential Through Gallery Stories
Gallery Stories turn Potential data into a forward-looking picture of what could become possible next—for people, teams, products, markets, revenue, learning, innovation, and the organization itself.
Potential is different from the other Talent Tree Nodes because much of its value points forward rather than backward. Roles and Activities can show what people have done. Skills can show capabilities they have demonstrated. Wisdom can reveal what experience has taught them. Intelligence and Creativity can show how people understand problems and generate new possibilities.
Potential asks:
Given everything we can see now, what opportunities could we realistically grow into next?
Within the Talent Tree, Potential is the crown of the system: the future-facing expression of growth, possibility, and becoming. But it is not intended to be wishful thinking. Potential becomes useful when possibilities can be connected to the existing Stories, capabilities, resources, relationships, interests, opportunities, and conditions that could help make them real.
The examples below are Gallery templates, not fixed dashboards. Depending on the organization, Potential might include future Roles, emerging Skills, learning pathways, innovation projects, grants, funding opportunities, sales opportunities, new markets, partnerships, R&D initiatives, strategic possibilities, or other future-facing Stories.
| Where Is Our Growth Potential Concentrated? See the areas of future opportunity currently appearing most strongly across the organization. Potential Stories might cluster around: Learning & Growth Potential Career Advancement Potential Innovation & Invention Potential Leadership Potential Civic & Social Impact Potential Resource & Funding Potential Future Visioning & Systems Change Potential This provides a high-level view of where the organization currently sees room to grow. Importantly, these aren’t necessarily predictions that something will happen. They are structured representations of opportunities that people or organizations have identified and begun connecting to supporting evidence elsewhere in the Tree. | What Kinds of Potential Are Emerging? Roll detailed Potential Stories into broader Branches to understand the overall composition of future opportunity. One organization might show a strong concentration of Technical & Professional Development Potential. Another may be generating significant Innovation, Leadership, Market, Social Impact, or Systems Change opportunities. The Talent Tree’s 12×12 structure allows those broad categories to contain much more specific possibilities beneath them, just as it does for every other Node. Stories are ultimately attached at the Sub-Branch level while retaining their Details, Evidence, Data, and associations. That lets leaders move between: What kinds of opportunities are emerging? and: What exactly are those opportunities? | Which Activities Create the Most Future Opportunities? Connect current Activities with the Potential Stories they appear to create. Product Development may generate: Innovation Potential Market Potential Technical Growth Potential Customer Experience work may reveal: Service Innovation Relationship Growth Market Opportunity Research and Discovery might create: Learning Potential R&D Potential New Product Potential Systems Change Strategy Activities may generate: Leadership Potential Market Opportunity Future Visioning This helps TalentSync reveal something conventional activity tracking usually misses: What new possibilities are being created by the work we’re doing today? An Activity therefore doesn’t have to end when the work is complete. It can create new Potential Stories that become starting points for what happens next. | Which Roles Are Ready for What’s Next? Compare demonstrated experience with future Role opportunities. A Product Manager may already have Stories supporting movement toward a Strategy Role. A Customer Success professional may demonstrate Activities and Skills relevant to Product Operations. An Engineer may have accumulated the Technical Skills, Intelligence, and customer-facing experience relevant to becoming a Solutions Architect. A Marketing professional may show evidence supporting a future Growth Strategy Role. The important distinction is that TalentSync does not need to infer future readiness from a job title alone. It can examine the connected evidence already present across the Talent Tree. That creates a richer question: What future Roles are becoming plausible based on what people have actually been doing, learning, demonstrating, and developing? |
| Where Are Our Strongest Internal Mobility Pathways? Identify recurring pathways between current experience and adjacent future Roles. Examples might include: Customer Success → Product Operations Marketing → Growth Strategy Data Analyst → Data Scientist Software Engineer → Solutions Architect HR Generalist → People Partner Support Specialist → Implementation Lead This turns internal mobility into something more than a list of open jobs. TalentSync can begin showing where existing talent is already building the experiences and capabilities that support another kind of contribution. This is particularly important to Gobekli’s broader talent model because Roles are only one part of a person’s Talent Tree. The associations among Roles, Activities, Skills, Interests, Intelligence, Wisdom, and other Nodes can reveal pathways that a conventional résumé or HRIS title hierarchy might never expose. | What Does Our Sales Opportunity Pipeline Look Like? Potential can also represent concrete commercial opportunities. A sales opportunity is, quite literally, potential value that has not yet been realized. TalentSync can visualize opportunities moving through stages such as: Lead → Qualified → Discovery → Proposal → Negotiation → Closed and aggregate the potential value represented at each stage. But the Talent Tree can add another dimension to conventional pipeline reporting. An opportunity can also connect with the Roles, Activities, Technical Skills, Human Skills, Voice, relationships, Agency, and other resources required to pursue it. That means leaders can eventually examine not only: How much pipeline do we have? but: Do we have the human capability and organizational conditions required to convert it? | Where Is Our Sales Potential Coming From? See the sources generating future commercial opportunity. Potential revenue might emerge through: Existing Accounts New Enterprise Opportunities Strategic Partnerships Government & Public Sector Educational Institutions Professional Associations New Products or Services This gives leaders a portfolio view of commercial Potential. It can also connect back to the Tree. For example, strong Potential in a new market may become more meaningful when TalentSync can also see relevant industry Interests, customer Activities, relationship Roles, Technical Skills, market Wisdom, and sales capability already present in the organization. Potential therefore becomes more than a CRM forecast. It becomes part of the organization’s broader map of what it may be positioned to pursue. | How Much Market Potential Are We Positioned to Reach? Zoom farther outward from known sales opportunities to the larger market landscape. A Gallery Story might compare: Total Addressable Market Serviceable Available Market Near-Term Serviceable Obtainable Market The important TalentSync distinction is the final phrase: positioned to reach. A large market is not automatically meaningful Potential. The organization also needs some combination of: relevant Skills appropriate Roles market knowledge relationships Agency resources operational capacity Voice and reputation sales capability strategic alignment So market Potential can eventually be examined alongside the organizational readiness represented elsewhere in the Combined Tree. This connects external opportunity with internal capability. |
| Which New Ideas Have the Highest Realization Potential? Connect Creativity with Potential by comparing promising ideas with the organization’s ability to bring them to life. Examples might include: a new AI service a credential network a new marketplace recruiter automation an enterprise analytics module a new membership offering Each idea can be considered along at least two dimensions: Opportunity — How valuable or meaningful could this become? Readiness — How much of what is needed to pursue it is already available? The readiness side might draw on evidence such as relevant Skills, available Roles, Activities already underway, funding, partnerships, technical capacity, market knowledge, or other organizational resources. This creates an important relationship between the upper Nodes: Creativity generates possibilities. Intelligence helps understand them. Wisdom helps judge them. Potential asks which possibilities could become real. | Where Are Grants, Funding & R&D Opportunities Building? Potential is not limited to careers or sales. Organizations may also be pursuing future resources through: grants research funding R&D initiatives strategic partnerships internal investment competitions or challenges philanthropic support These opportunities can be represented as Potential Stories and connected to the people, capabilities, projects, and outcomes they could enable. A grant opportunity, for example, might connect with: Interests — the subject area Roles — investigators or program leaders Activities — research already underway Technical Skills — required expertise Voice — proposal development Agency — eligibility or institutional authority Potential — future funding and impact This makes future resources visible as part of the same interconnected talent system rather than leaving them in a separate planning spreadsheet. | How Is Our Potential Evolving Over Time? Track the future-facing opportunities that are growing, changing, appearing, or disappearing. The organization might see growth in: Innovation Projects Emerging Skills Learning Capacity Sales Pipeline Value New Role Pathways Market Opportunities Strategic Partnerships Potential should naturally change faster than many other Nodes because the future itself changes. A new technology can create an entirely new capability opportunity. A partnership can open a market. A new employee can unlock an Activity the organization previously couldn’t perform. A successful experiment can turn a speculative idea into a viable initiative. A market change can make yesterday’s opportunity irrelevant. This Gallery Story therefore treats Potential as a living horizon, continually recalculated as the rest of the Tree evolves. | What Is Unlocking—or Blocking—Our Potential? Finally, compare the size of an opportunity with the organization’s current ability to act on it. Potential may be constrained or enabled by: Skills & Capabilities Agency & Decision Authority Funding & Resources Leadership Capacity Market Access Learning Capacity Relationships Technology Time This is where Potential reconnects to the entire Tree. An organization may see enormous market opportunity but lack the Skills required to pursue it. A person may be highly capable but lack Agency, sponsorship, or access. A team may have a powerful idea but insufficient resources. A new Role may be within reach if one or two missing capabilities are developed. Potential therefore isn’t simply: “What could happen?” It is: “What could happen—and what would need to become true for us to make it happen?” That distinction is central to the Talent Tree. Agency represents the enabling conditions that allow action, while Stories and associations throughout the Tree reveal the experiences, capabilities, resources, and relationships from which future possibilities emerge. |
From Possibility to Realization
Together, these Gallery Stories make Potential something much more useful than an abstract prediction about the future.
TalentSync can explore:
What opportunities are emerging?
Which people and teams are positioned to grow?
What new Roles are becoming realistic?
What Activities are creating future value?
What sales opportunities are developing?
Which markets could we realistically reach?
Which ideas are closest to realization?
What funding could unlock new work?
Where is our future opportunity growing?
And what is currently preventing possibility from becoming reality?
This is also where the Combined Talent Tree can become especially powerful.
Potential can be understood as an emerging consequence of the entire system:
Agency determines what can be acted upon.
Motivation supplies energy and direction.
Identity shapes who people and organizations believe they can become.
Interests pull attention toward new domains.
Roles provide contexts for participation.
Activities create experience.
Voice expresses possibilities and brings others into them.
Human and Technical Skills provide capability.
Wisdom carries lessons from what has already happened.
Intelligence helps interpret the situation.
Creativity generates new possibilities.
And Potential represents the horizon those forces make visible.
That is why Potential belongs at the crown of the Talent Tree.
It isn’t simply another category of talent data.
It is the place where everything the Tree knows about who we are, what we have done, what we can do, what we have learned, and what we can imagine begins to answer the most future-facing question in the system:
What could we do next?
Coming Soon
Coming Soon
Coming Soon
Coming Soon